Functions for Tabular Reporting

Use a grammar for creating and customizing pretty tables. The following formats are supported: 'HTML', 'PDF', 'Typst', 'RTF', 'Microsoft Word', 'Microsoft PowerPoint', R 'Grid Graphics' and 'patchwork'. 'R Markdown', 'Quarto' and the package 'officer' can be used to produce the result files. The syntax is the same for the user regardless of the type of output to be produced. A set of functions allows the creation, definition of cell arrangement, addition of headers or footers, formatting and definition of cell content with text and or images. The package also offers a set of high-level functions that allow tabular reporting of statistical models and the creation of complex cross tabulations.


flextable R package

R buildstatus version testcoverage Active

The flextable package provides a framework for easily creating tables for reporting and publications. Tables can be formatted with a set of verbs such as bold(), color(), they can receive a header of more than one line, cells can be merged or contain an image. The package makes it possible to build any table for publication from a data.frame and provides convenience function as_flextable() to convert several R objects to a flextable, such as an object returned from table() or a model.

Tables can be embedded within HTML, PDF, Word and PowerPoint documents from R Markdown and Quarto documents (plus Typst with Quarto) and within RTF or Microsoft Word or PowerPoint documents with package officer. Tables can also be exported as image files (png, svg) or combined with ggplot2 plots in patchwork layouts.

flextable(mtcars) |>
  theme_vanilla() |>
  save_as_docx(path = "mytable.docx")

A flextable object is a data.frame representation. An API is available to let R users create tables for reporting and control their formatting properties and their layout. The package provides functions that give control over:

  • header, body and footer content
  • text, paragraphs, cells and border formatting of any element
  • displayed values

The package also offers a set of high-level functions that allow tabular reporting of statistical models and the creation of complex cross tabulations.

Examples

library(flextable)

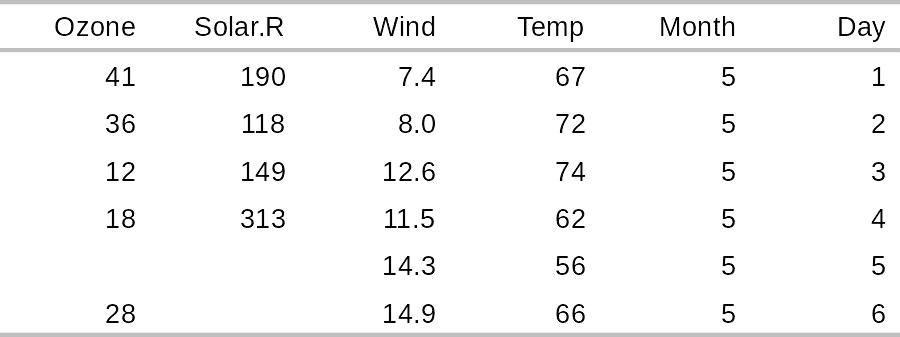
flextable(head(airquality))
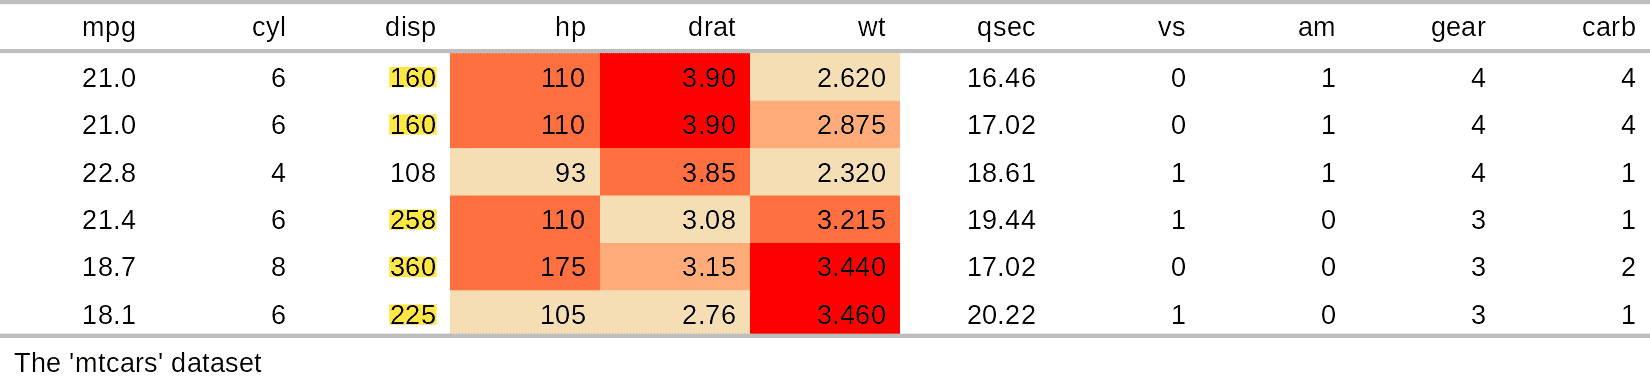
Formatting can be layered on with a set of functions:

flextable(head(mtcars)) |>
  highlight(i = ~ mpg < 22, j = "disp", color = "#ffe842") |>
  bg(
    j = c("hp", "drat", "wt"),
    bg = scales::col_quantile(palette = c("wheat", "red"), domain = NULL)
  ) |>
  add_footer_lines("The 'mtcars' dataset")
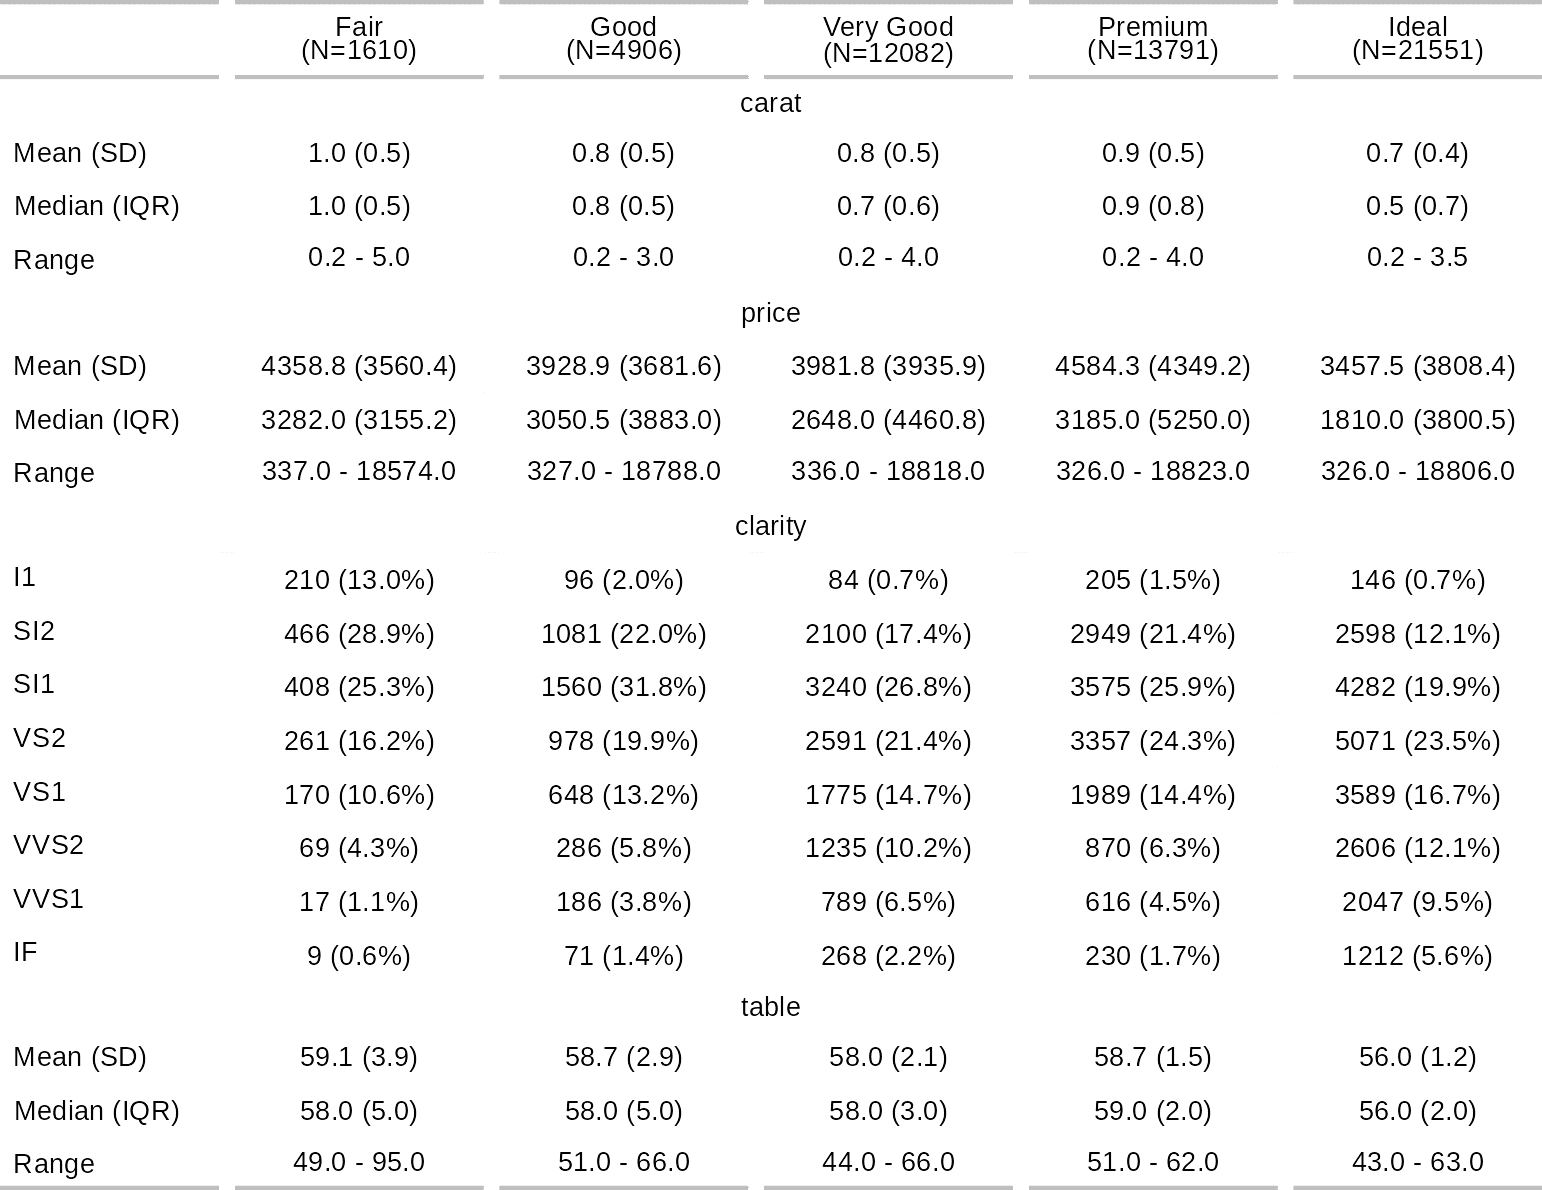
ggplot2::diamonds[, c("cut", "carat", "price", "clarity", "table")] |>
  summarizor(by = c("cut")) |>
  as_flextable(spread_first_col = TRUE)
Installation

install.packages("flextable")

You can get the development version from GitHub:

devtools::install_github("davidgohel/flextable")

Resources

Bug reports

When you file a bug report, please spend some time making it easy for us to reproduce. If you take the time to make the bug report consistent, it will be easier to fix.

Reference manual

It appears you don't have a PDF plugin for this browser. You can click here to download the reference manual.

install.packages("flextable")

0.10.3 by David Gohel, 9 days ago


https://ardata-fr.github.io/flextable-book/, https://davidgohel.github.io/flextable/


Report a bug at https://github.com/davidgohel/flextable/issues


Browse source code at https://github.com/cran/flextable


Authors: David Gohel [aut, cre] , ArData [cph] , Clementine Jager [ctb] , Eli Daniels [ctb] , Panagiotis Skintzos [aut] , Quentin Fazilleau [ctb] , Maxim Nazarov [ctb] , Titouan Robert [ctb] , Michael Barrowman [ctb] , Atsushi Yasumoto [ctb] , Paul Julian [ctb] , Sean Browning [ctb] , Rémi Thériault [ctb] , Samuel Jobert [ctb] , Keith Newman [ctb]


Documentation:   PDF Manual  


GPL-3 license


Imports data.table, gdtools, graphics, grDevices, grid, htmltools, knitr, officer, ragg, rlang, rmarkdown, stats, utils, uuid, xml2

Suggests bookdown, broom, broom.mixed, chromote, cluster, commonmark, doconv, equatags, formatters, ggplot2, gtable, jsonlite, lme4, magick, mgcv, nlme, officedown, patchwork, pdftools, pkgdown, rtables, scales, svglite, tables, testthat, webshot2, withr, xtable


Imported by AeroSampleR, Certara.DarwinReporter, Certara.ModelResults, DSIR, DemographicTable, EasyStat, EpiReport, GRShiny, GrowthCurveME, MAGMA.R, MCPModPack, MassWateR, MedianaDesigner, MultiResponseR, Rbearcat, Rrepest, StepRegShiny, SurveyDefense, TernTables, TestAnaAPP, VisualizeSimon2Stage, WordR, aNCA, activAnalyzer, apa7, apmx, assertHE, autoReg, autoslider.core, boot.pval, clinify, codebookr, compareGroups, convertxlsform, crane, crosstable, ctoclient, dentomedical, dryingkineticmodels, easytable, edar, eoffice, epiR, examly, export, fitODBODRshiny, ftExtra, furniture, glioblastomaEHRsData, gtregression, gtstats, heterogeneouspeereffects, inTextSummaryTable, interactionR, interpretCI, ivo.table, joinpointR, jsmodule, junco, kfa, ladder, manymome.table, measureR, microplot, munch, nlmixr2rpt, onbrand, ordPanel, pmxcode, polish, presenter, projectLSA, pwrFDR, reappraised, relMix, repmod, rjd3production, robmedExtra, rrtable, rsides, rtables.officer, ruminate, sMSROC, scaledescr, shinySbm, statAPA, stepssurvey, summarySCI, teal.reporter, toxSummary, tracee, tsg, tsgarch, tsissm, tstests, ubiquity, visvaR, warabandi, washi, webr, wrappedtools, ztable.

Suggested by ACRER, Certara.RsNLME, Certara.Xpose.NLME, CodelistGenerator, CohortCharacteristics, CohortSurvival, CohortSymmetry, DrugUtilisation, EpiQuestionR, FAfA, GLMMcosinor, IncidencePrevalence, LightLogR, MIC, MeasurementDiagnostics, Mediana, OmopSketch, PsychoMatic, R4VN, SUMO, SimtablR, Slick, StepReg, accessr, autocodebook, autostats, basictabler, bayesMeanScale, brand.yml, bsitar, clinUtils, dceasimR, doconv, fitODBOD, flexlsx, formods, greenbook, gridify, gtsummary, htaBIM, huxtable, invitroTKstats, irtrees, lavaanExtra, lssdoc, magentabook, mfrmr, mitey, modelsummary, mpwR, multitool, munsellinterpol, officedown, performance, phsmethods, polarzonoid, predictNMB, prismadiagramR, quartabs, quarto, quartose, rempsyc, reservr, rice, rmsMD, sitrep, soc.ca, speccurvieR, spicy, statAfrikR, strand, summata, surveytable, table1, visOmopResults.


See at CRAN