gtregression
Tools for Creating Publication-Ready Regression Tables
Simplifies regression modelling in R by integrating modelling, diagnostics,
visualisation, and summary tools into a cohesive, user-friendly
interface. Designed to be accessible for researchers, particularly those in
Low- and Middle-Income Countries (LMIC). Supports logistic, linear, count,
matched case-control, ordinal, multinomial, multilevel, Cox, parametric
survival, and competing-risk regression, and absolute risk differences with
the number needed to treat. Built upon widely accepted
statistical methods, including logistic regression
(Hosmer et al. 2013, ISBN:9781118548429), log-binomial regression
(Spiegelman and Hertzmark 2005
R package for health research
gtregression
From model to manuscript. Fit regression and survival models, and get tables, forest plots and survival curves ready for your paper, without hand-formatting a single coefficient.
install.packages("gtregression")



What you can make
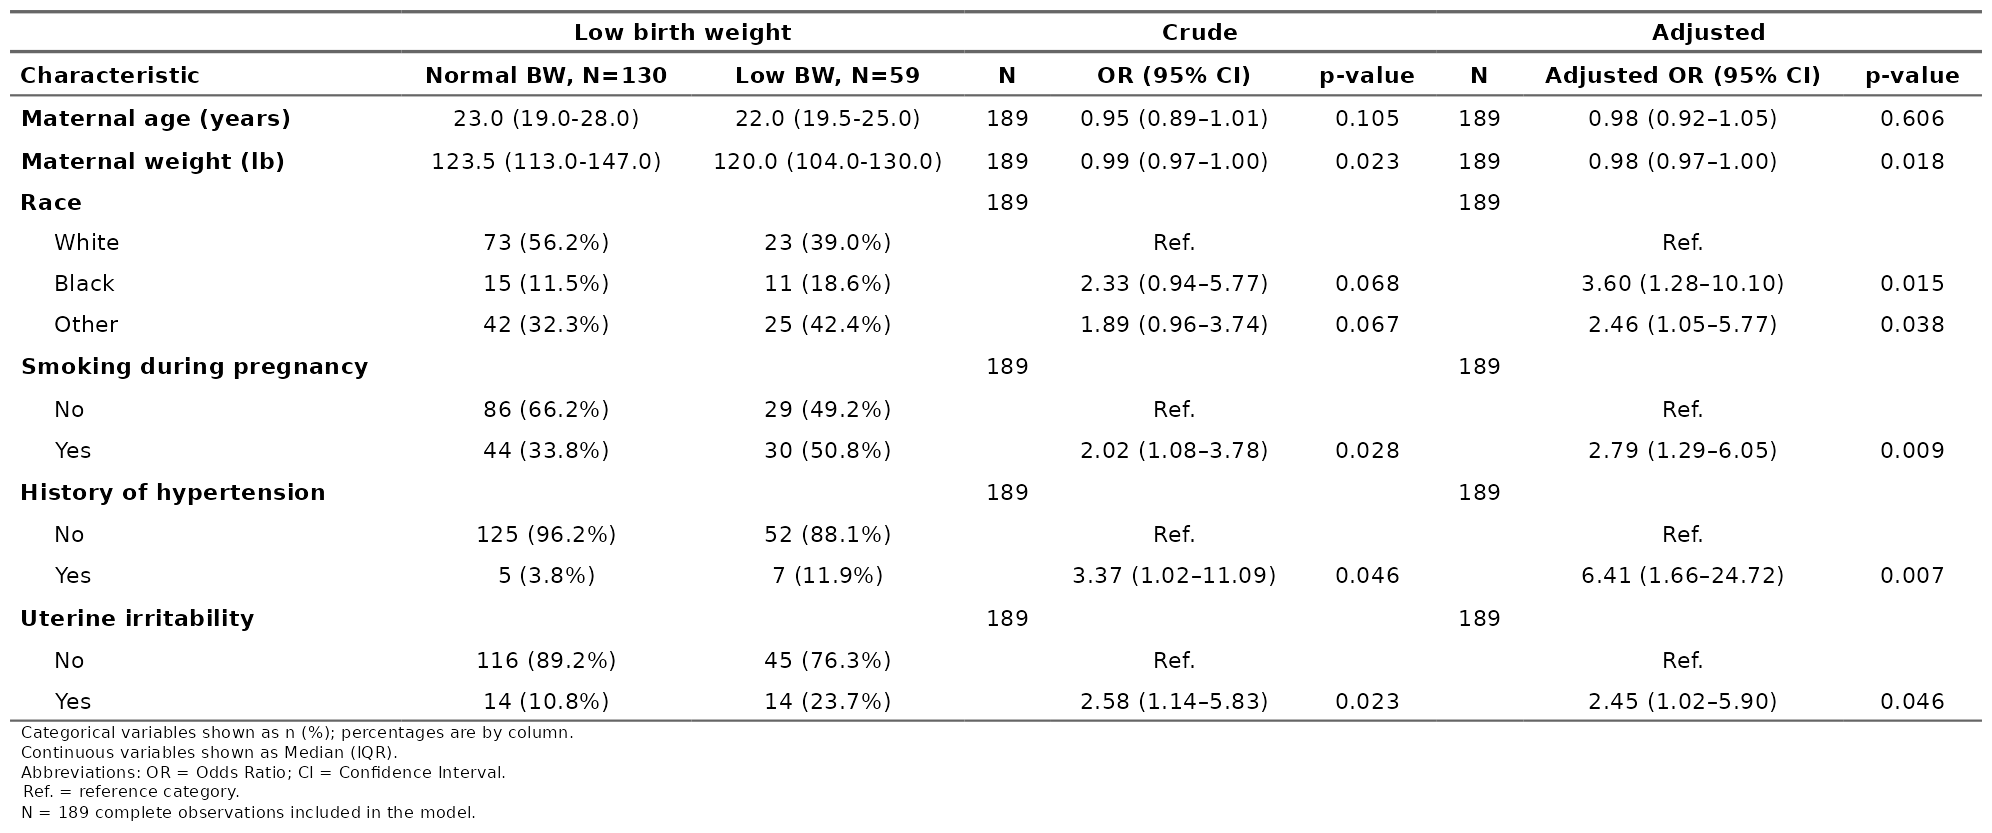 Manuscript tables
Descriptive, crude and adjusted results
merged into one table, with every footnote kept.
Manuscript tables
Descriptive, crude and adjusted results
merged into one table, with every footnote kept.
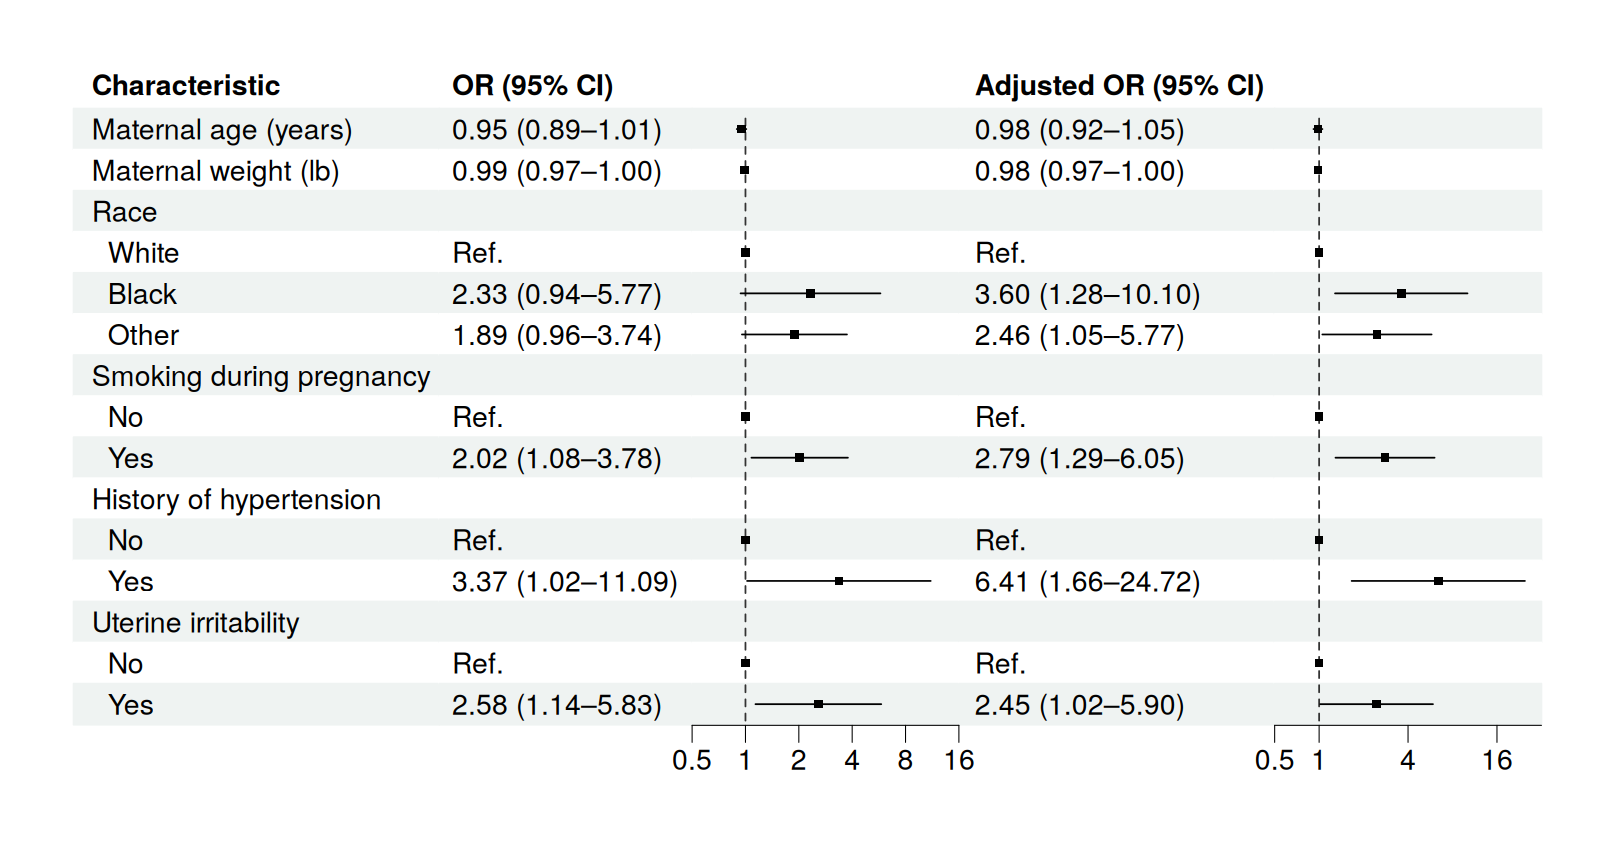 Forest plots
Crude and adjusted estimates side by side,
straight from the fitted models.
Forest plots
Crude and adjusted estimates side by side,
straight from the fitted models.
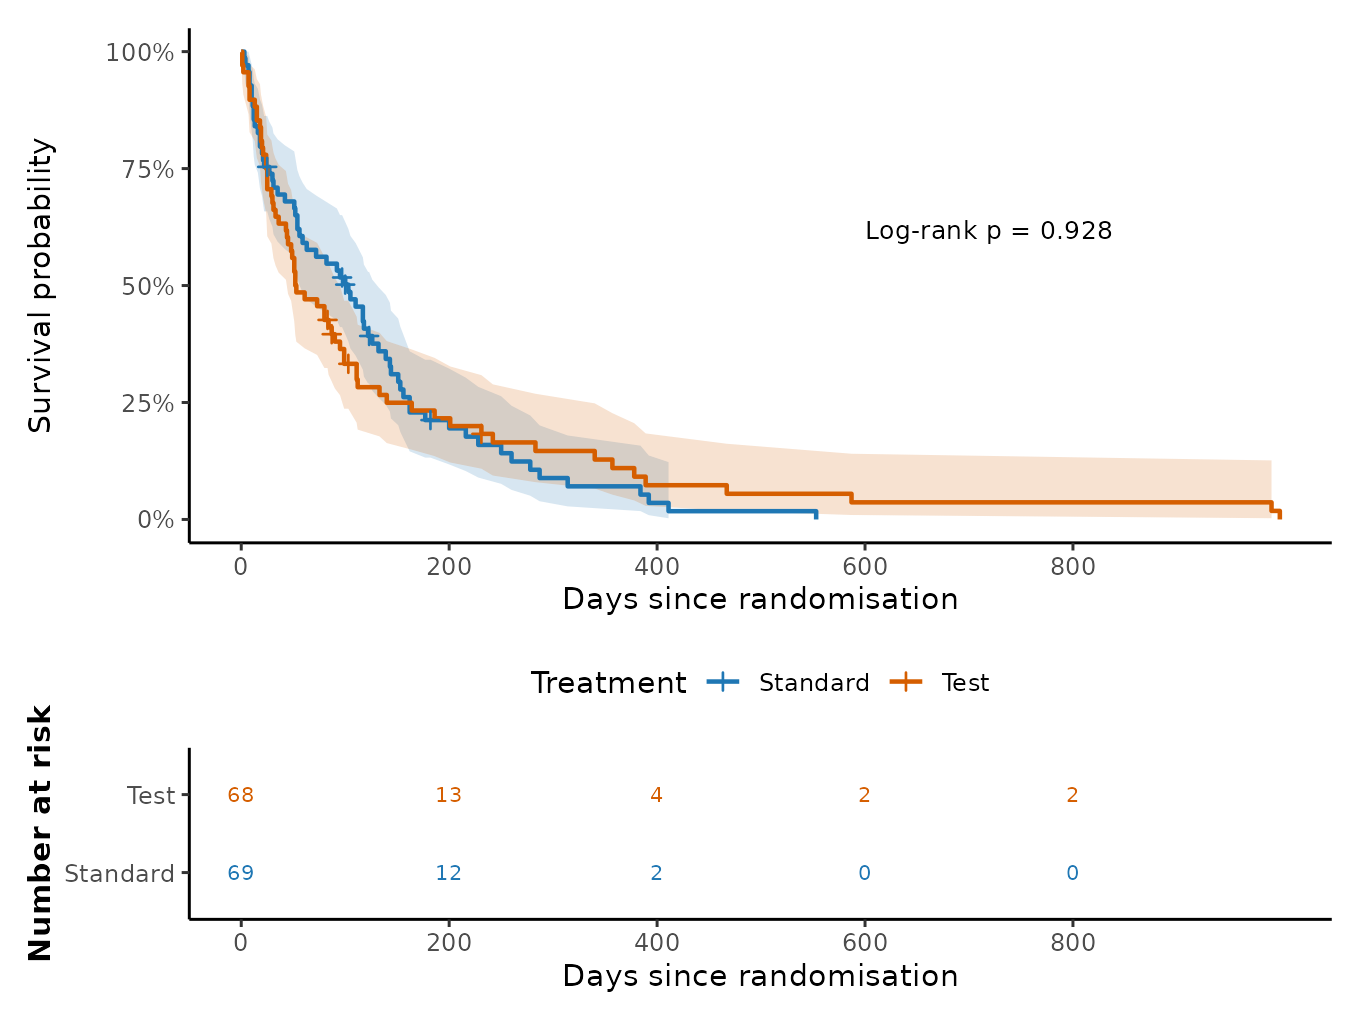 Survival analysis
Kaplan-Meier curves, Cox and parametric
models, competing risks and RMST.
Survival analysis
Kaplan-Meier curves, Cox and parametric
models, competing risks and RMST.
 Absolute effects
Risk differences and the number needed to
treat, crude or adjusted.
Absolute effects
Risk differences and the number needed to
treat, crude or adjusted.
New in 1.2.0
Risk difference and NNT
risk_difference() reports
absolute risks, the risk difference and NNTB/NNTH, crude or
adjusted.
More study designs Matched case-control, multilevel, ordinal, multinomial and competing-risk regression tables.
Richer survival tools Proportional-hazards plots, delayed entry, clustering, weights and adjusted survival curves.
Better merging Merge any number of tables, keep each block’s notes, and choose a table theme.
Read the full list of changes.
From data to manuscript
01
Prepare
Check variables, labels, levels and missing data.
dissect()
Analysis-ready data
02
Describe
Build a clear baseline table before modelling.
descriptive_table()
Table 1
03
Model
Fit crude, adjusted, stratified or survival models.
uni_reg() multi_reg()
Effect estimates
04
Interpret
Check assumptions, confounding, interaction and fit.
check_ph() compare_models()
A defensible model
05
Publish
Merge, visualise and export.
merge_tables() save_table()
Manuscript-ready output
A five-minute example
library(gtregression)
library(dplyr)

data("data_birthwt", package = "gtregression")

birthwt <- data_birthwt |>
  mutate(
    race = factor(race, levels = c(1, 2, 3), labels = c("White", "Black", "Other")),
    smoke = factor(smoke, levels = c(0, 1), labels = c("No", "Yes")),
    ht = factor(ht, levels = c(0, 1), labels = c("No", "Yes")),
    low = factor(low, levels = c(0, 1), labels = c("Normal BW", "Low BW"))
  )

attr(birthwt$smoke, "label") <- "Smoking during pregnancy"
exposures <- c("age", "lwt", "race", "smoke", "ht")

# Baseline characteristics by outcome
desc <- descriptive_table(birthwt, exposures = exposures, by = "low",
                          show_dichotomous = "all_levels")

# One model per exposure, then one adjusted model
crude <- uni_reg(birthwt, outcome = "low", exposures = exposures, approach = "logit")
adjusted <- multi_reg(birthwt, outcome = "low", exposures = exposures, approach = "logit")

# One table for the paper, and a forest plot
table_2 <- merge_tables(desc, crude, adjusted,
                        spanners = c("Low birth weight", "Crude", "Adjusted"))
forest <- forest_reg(forest_df(crude, adjusted))

# Save
save_table(table_2, filename = "table-2", format = "docx")
save_forest(forest, filename = "forest-plot", format = "png")
Variable labels set with attr(x, "label") or labelled::var_label()
appear in every table and plot. Each result keeps its fitted models
(adjusted$models) and table data (adjusted$table_body), so nothing
is hidden.
Find your way
Describe dataBaseline tables with row or column percentages.
Regression tablesLogistic, risk ratio, count, linear and Firth models.
Special designsMatched, multilevel, ordinal, multinomial and competing risks.
Survival analysisKaplan-Meier, Cox, parametric models and predictions.
Risk difference and NNTAbsolute effects for two-group comparisons.
Stratified analysisThe same model within each subgroup.
Confounding and interactionScreen confounders and test effect modification.
Causal mediationDirect and indirect effects with clear caveats.
DiagnosticsConvergence, collinearity, fit and model comparison.
VisualiseRegression plots, forest plots and survival curves.
Merge and customiseCombine tables, apply themes, style with flextable.
Built on trusted R packages
gtregression is a readable interface over established packages:
stats, survival, MASS, risks and logistf fit the models;
broom, sandwich and lmtest handle inference; flextable,
officer and gt build the tables; ggplot2, patchwork and
forestploter draw the figures. The fitted models stay inside every
result, so each number can be traced back to its source.
Install
# CRAN
install.packages("gtregression")

# Development version
remotes::install_github("ThinkDenominator/gtregression")
Citation
If you use gtregression in your work, please cite it as:
Polani R, Eliyas SK, Sakthivel M, Kaviprawin M, Krishnamoorthy Y, Majella MG. gtregression: Tools for Creating Publication-Ready Regression Tables. Zenodo. https://doi.org/10.5281/zenodo.16905349