Ridgeline Plots in 'ggplot2'

Ridgeline plots provide a convenient way of visualizing changes in distributions over time or space. This package enables the creation of such plots in 'ggplot2'.


ggridges: Ridgeline plots in ggplot2

R buildstatus CoverageStatus CRAN_Status_Badge CRAN_Downloads_Badge Lifecycle:maturing

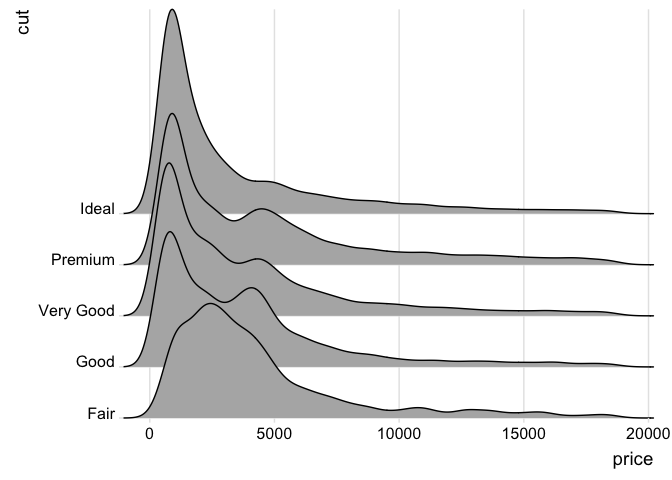
Ridgeline plots are partially overlapping line plots that create the impression of a mountain range. They can be quite useful for visualizing changes in distributions over time or space.

Installation

Please install the stable release from CRAN:

install.packages("ggridges")

Alternatively, you can install the latest development version from github:

remotes::install_github("wilkelab/ggridges")

Usage

library(ggplot2)
library(ggridges)
    
ggplot(diamonds, aes(x = price, y = cut)) +
  geom_density_ridges(scale = 4) + 
  scale_y_discrete(expand = c(0, 0)) +     # will generally have to set the `expand` option
  scale_x_continuous(expand = c(0, 0)) +   # for both axes to remove unneeded padding
  coord_cartesian(clip = "off") + # to avoid clipping of the very top of the top ridgeline
  theme_ridges()
#> Picking joint bandwidth of 458
Documentation and Examples

First read the package vignette. Then read the reference manual.

Reference manual

It appears you don't have a PDF plugin for this browser. You can click here to download the reference manual.

install.packages("ggridges")

0.5.7 by Claus O. Wilke, a year ago


https://wilkelab.org/ggridges/


Report a bug at https://github.com/wilkelab/ggridges/issues


Browse source code at https://github.com/cran/ggridges


Authors: Claus O. Wilke [aut, cre] (ORCID:


Documentation:   PDF Manual  


GPL-2 | file LICENSE license


Imports ggplot2, grid, scales, withr

Suggests covr, dplyr, patchwork, ggplot2movies, forcats, knitr, rmarkdown, testthat, vdiffr


Imported by Analitica, BGGM, BasicStatsPlots, BayesPostEst, Bchron, CEDA, DiscreteDLM, EMOTIONS, GPTCM, GenomeAdmixR, HDStIM, HistDAWass, IRTM, NeEDS4BigData, RADstackshelpR, Robyn, SHELF, SNPfiltR, SUMMER, SelectSim, Seurat, Spectran, TITAN2, atRisk, bayesplot, besthr, brms.mmrm, cash, dittoViz, dlmtree, easyalluvial, ethnobotanyR, exploratory, ezr, footBayes, forestecology, ggFishPlots, ggScatRidges, ggquickeda, gravitas, hdpGLM, jmv, myTAI, pcvr, rsimsum, sae4health, scGate, scatr, shoredate, ssMutPA, stxplore, surveyPrev, tRigon, trackeR, vismi.

Depended on by ggformula.

Suggested by AlphaPart, GeoTox, MiscMetabar, PsyMetricTools, SCpubr, TmCalculator, WpProj, aggreCAT, bartMan, baytaAAR, bench, bsitar, circhelp, clayringsmiletus, coveffectsplot, datplot, dispositionEffect, funbiogeo, genekitr, ggdibbler, ggpicrust2, grwat, hatchR, imageRy, melt, mitey, mosaic, netify, oxcAAR, phyr, plotly, plotthis, poisonfrogs, r4ds.tutorials, readyomics, reservr, see, sentopics, shrinkr, sjPlot, specr, spotifyr, ssMRCD, trialr, wxgenR.

Enhanced by jamba.


See at CRAN
