plotthis
High-Level Plotting Built Upon 'ggplot2' and Other Plotting Packages
Provides high-level API and a wide range of options to create stunning, publication-quality plots effortlessly. It is built upon 'ggplot2' and other plotting packages, and is designed to be easy to use and to work seamlessly with 'ggplot2' objects. It is particularly useful for creating complex plots with multiple layers, facets, and annotations. It also provides a set of functions to create plots for specific types of data, such as Venn diagrams, alluvial diagrams, and phylogenetic trees. The package is designed to be flexible and customizable, and to work well with the 'ggplot2' ecosystem. The API can be found at < https://pwwang.github.io/plotthis/reference/index.html>.
plotthis 
plotthis is an R package that is built upon ggplot2 and other plotting packages. It provides high-level APIs and a wide range of options to create stunning, publication-quality plots effortlessly.
Installation
install.packages("plotthis")
# or to install the latest version:
remotes::install_github("pwwang/plotthis")
devtools::install_github("pwwang/plotthis")
You can also install the package using conda:
$ conda install pwwang::r-plotthis
Gallery
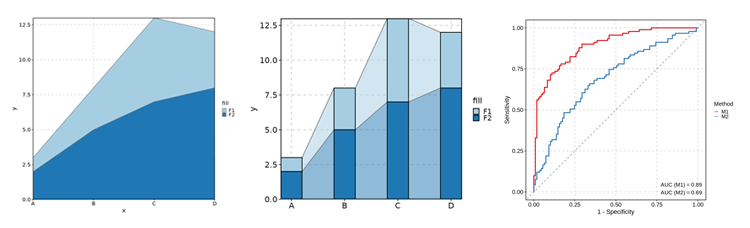
AreaPlot / TrendPlot / ROCCurve
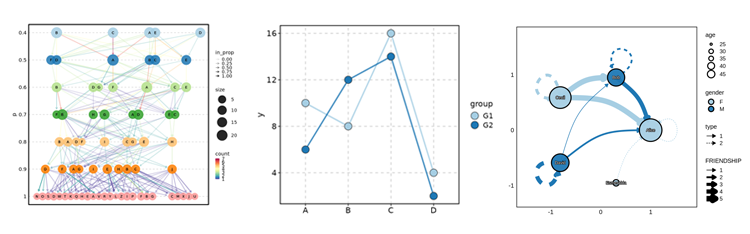
ClustreePlot / LinePlot / Network
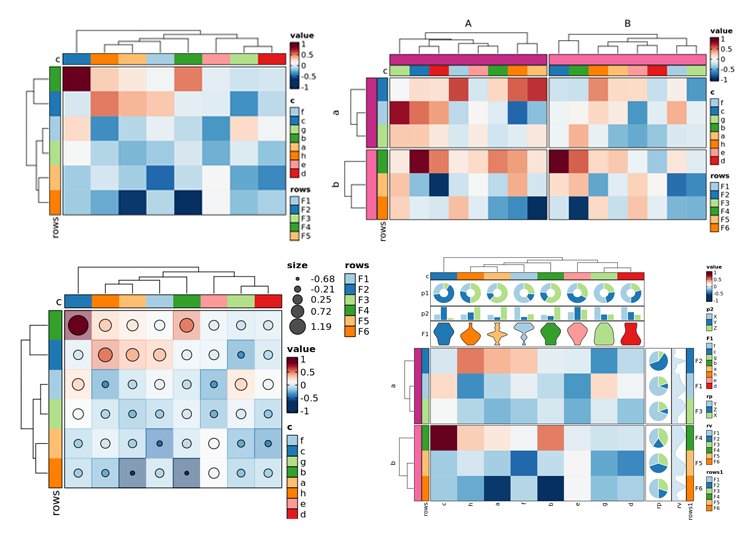
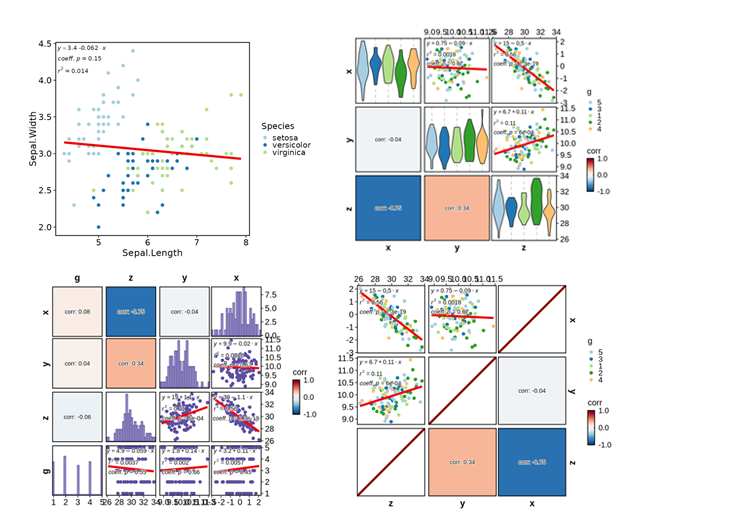
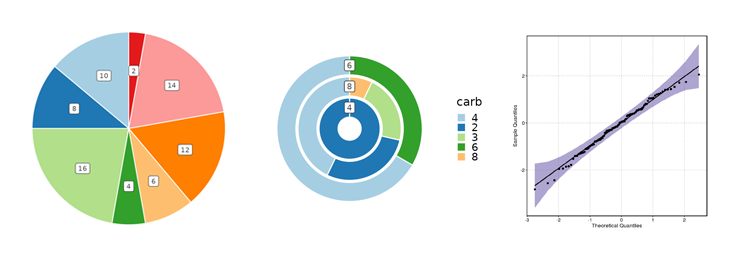
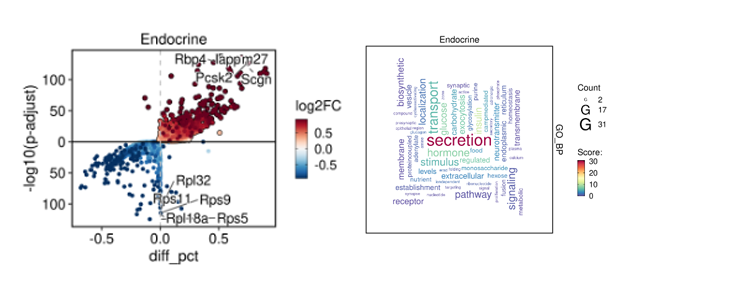
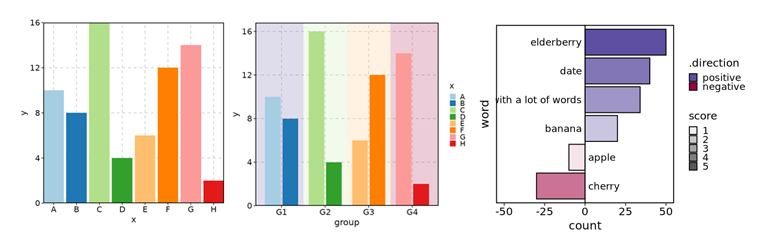
BoxPlot / ViolinPlot / BeeswarmPlot
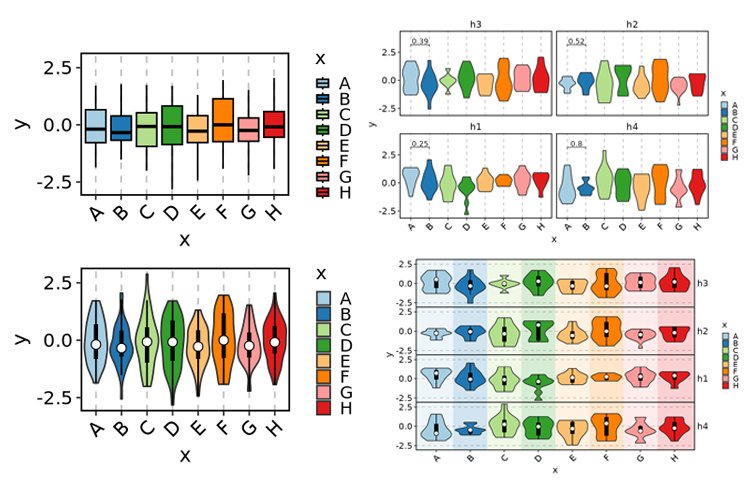
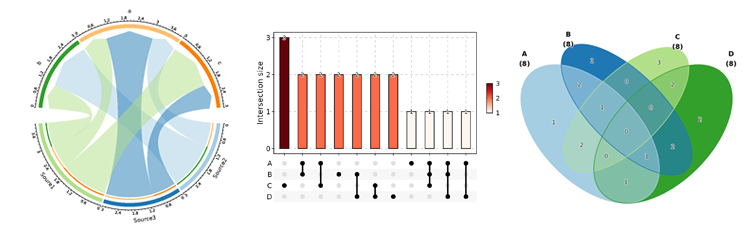
ChordPlot / UpsetPlot / VennDiagram
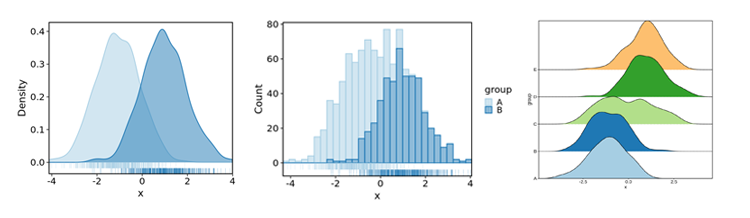
DensityPlot / Histogram / RidgePlot
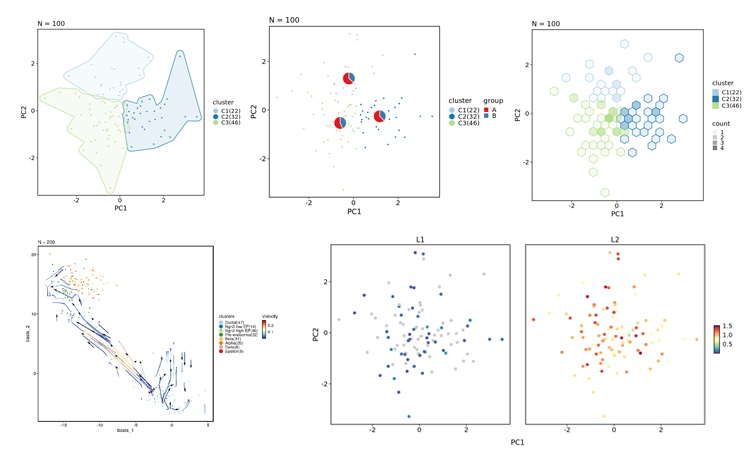
DimPlot / FeatureDimPlot / VelocityPlot
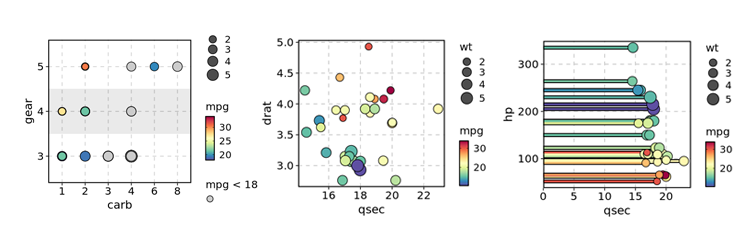
DotPlot / ScatterPlot / LollipopPlot
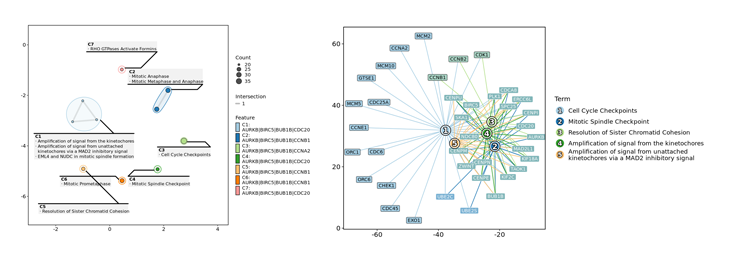
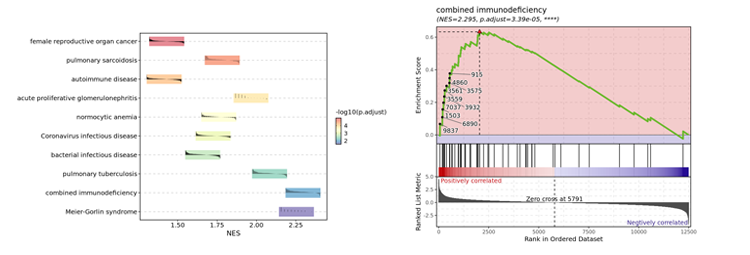
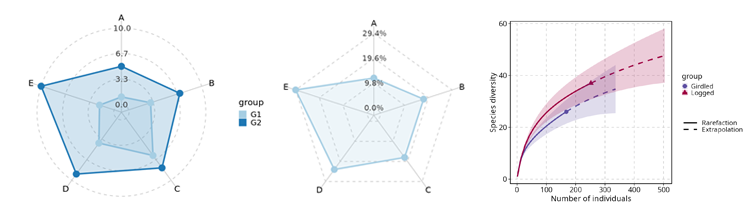
RadarPlot / SpiderPlot / RarefactionPlot
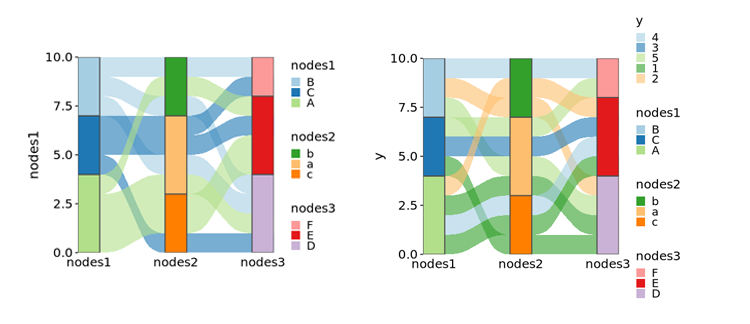
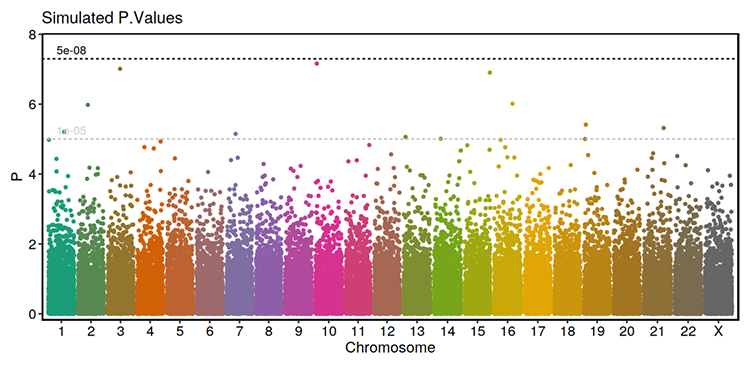
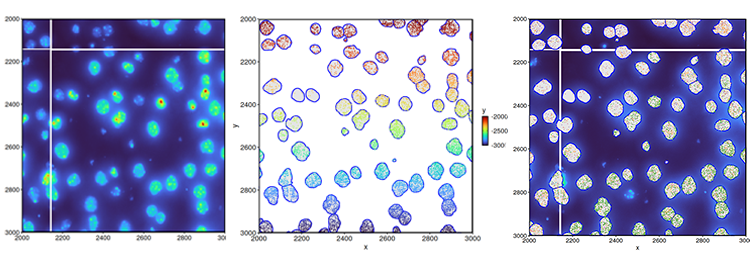
SpatImagePlot / SpatMasksPlot / SpatShapesPlot / SpatPointsPlot
Credits
plotthis is greatly inspired by the SCP package, but with the plotting functions detached from the Seurat object or single-cell data analysis. It is designed to be more flexible and general-purpose, and can be used for a wide range of data types and analysis scenarios.