WpProj
Linear p-Wasserstein Projections
Performs Wasserstein projections from the predictive distributions of any model into the space of predictive distributions of linear models. We utilize L1 penalties to also reduce the complexity of the model space. This package employs the methods as described in Dunipace, Eric and Lorenzo Trippa (2020)
WpProj: Linear p-Wasserstein Projections

The goal of WpProj is to perform Wasserstein projections from the
predictive distributions of any model into the space of predictive
distributions of linear models. This package employs the methods as
described in Eric Dunipace and Lorenzo Trippa
(2020). <arXiv:2012.09999>.
The Wasserstein distance is a measure of distance between two probability distributions. It is defined as
$$W_p(\mu,\nu) = \left(\inf_{\pi \in \Pi(\mu,\nu)} \int_{\mathbb{R}^d \times \mathbb{R}^d} |x-y|^p d\pi(x,y)\right)^{1/p}$$
where $\Pi(\mu,\nu)$ is the set of all joint distributions with marginals $\mu$ and $\nu$.
In the our package, if $\mu$ is the original prediction from the original model, such as from a Bayesian linear regression or a neural network, then we seek to find a new prediction $\nu$ that minimizes the Wasserstein distance between the two,
$$\mathop{\text{argmin}} _ {\nu} W _ {p}(\mu,\nu) ^ {p},$$
subject to the constraint that $\nu$ is a linear model.
To reduce the complexity of the number of parameters, we add an L1 penalty to the coefficients of the linear model to reduce the complexity of the model space,
$$\mathop{\text{argmin}} _ {\nu} W _ {p}(\mu,\nu) ^ {p} + P_{\lambda}(\nu),$$
where $P_\lambda(\nu)$ is a penalty on the complexity of the model space such as the the $L_1$ penalty on the coefficients of the linear model.
Installation
You can install the development version of WpProj from GitHub with:
# install.packages("devtools")
devtools::install_github("ericdunipace/WpProj")
Example
This is a basic example running the WpProj function on a simulated
dataset. Note we create a pseudo posterior from a simple dataset for
illustration purposes:
library(WpProj)
set.seed(23048)
# note we don't generate believable data with real posteriors
# these examples are just to show how to use the function
n <- 32
p <- 10
s <- 21

# covariates and coefficients
x <- matrix( stats::rnorm( p * n ), nrow = n, ncol = p )
beta <- (1:10)/10

#outcome
y <- x %*% beta + stats::rnorm(n)

# fake posterior
post_beta <- matrix(beta, nrow=p, ncol=s) + stats::rnorm(p*s, 0, 0.1)
post_mu <- x %*% post_beta #posterior predictive distributions

# fit models
## L1 model
fit.p2     <-  WpProj(X=x, eta=post_mu, power = 2.0,
                   method = "L1", #default
                   solver = "lasso" #default
)

## approximate binary program
fit.p2.bp <-  WpProj(X=x, eta=post_mu, theta = post_beta, power = 2.0,
                   method = "binary program",
                   solver = "lasso"
                   # this is the default because
                   # the approximate algorithm is faster
)
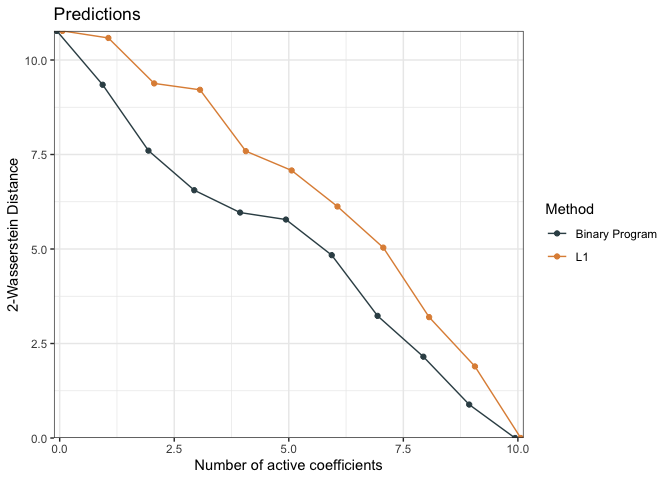
We can compare the performance of the models using the distCompare
function (measuring distance between the reduced models and the original
model) and then generate a plot
dc <- distCompare(models = list("L1" = fit.p2, "Binary Program" = fit.p2.bp),
                  target = list(parameters = post_beta,
                                  predictions = post_mu))
p <- plot(dc, ylabs = c("2-Wasserstein Distance", "2-Wasserstein Distance"))
p$parameters + ggplot2::ggtitle("Parameters")
p$predictions + ggplot2::ggtitle("Predictions")
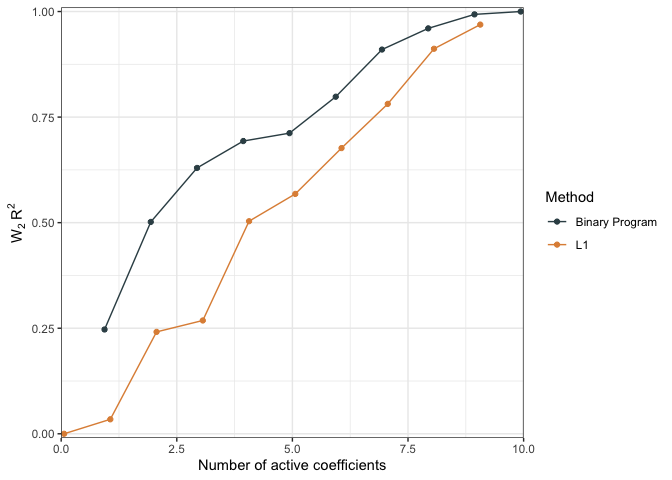
We can also compare performance by measure the relative distance between a null model and the predictions of interest as a pseudo $R^2$
r2.null  <- WPR2(projected_model = dc) # should be between 0 and 1
plot(r2.null)
We can also examine how the predictions change in the models as more covariates are added for individual observations.
ridgePlot(fit.p2, index = 21, minCoef = 0, maxCoef = 10)
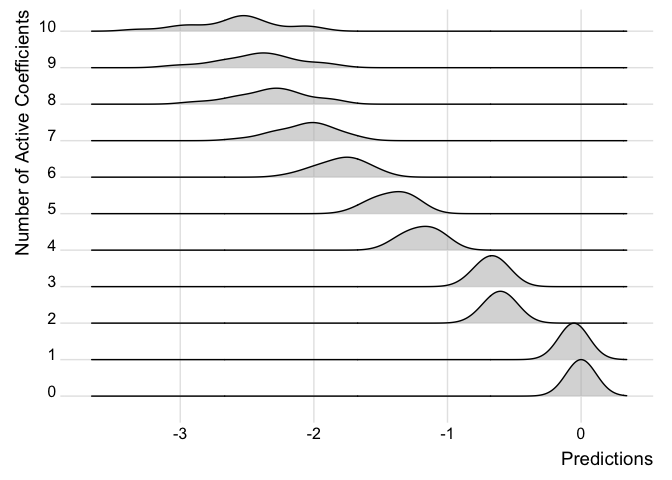
Note how the predictions get better the more coefficients are added and the distribution looks closer to the full posterior predictive.
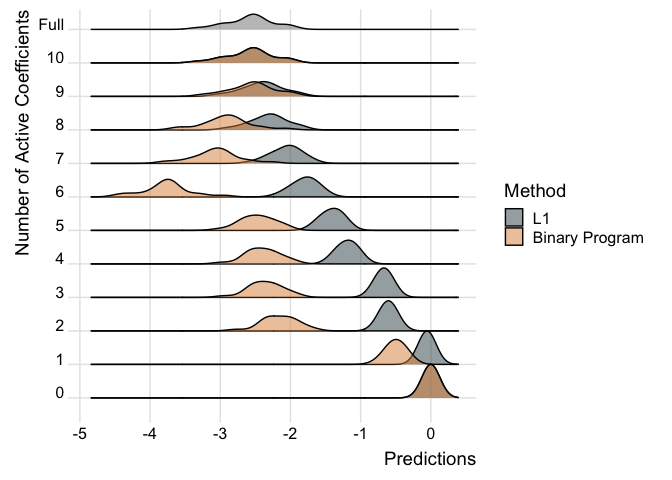
We can also compare the two models like so:
ridgePlot(list("L1" = fit.p2, "Binary Program" = fit.p2.bp), index = 21, minCoef = 0, maxCoef = 10, full = post_mu[21,])
References
Eric Dunipace and Lorenzo Trippa (2020).
Repository Overview
The package is structured like a typical R project with the following key directories:
R/– user-facing R functions and helper utilitiessrc/– C++ source code accessed through Rcpp for performance critical computationsman/– generated documentation for each exported functiontests/– automated tests written withtestthatinst/– package extras such as the spell checking word list
Supporting files such as DESCRIPTION and NAMESPACE define package
metadata and exported functions. New contributors may find it helpful to
start by exploring the R functions in R/ and the corresponding C++
implementations in src/.