FCPS
Fundamental Clustering Problems Suite
Over sixty clustering algorithms are provided in this package with consistent input and output, which enables the user to try out algorithms swiftly. Additionally, 26 statistical approaches for the estimation of the number of clusters as well as the mirrored density plot (MD-plot) of clusterability are implemented. The packages is published in Thrun, M.C., Stier Q.: "Fundamental Clustering Algorithms Suite" (2021), SoftwareX,

FCPS
Fundamental Clustering Problems Suite
The package provides over sixty state-of-the-art clustering algorithms for unsupervised machine learning published in .
Table of contents
Description
The Fundamental Clustering Problems Suite (FCPS) summaries over sixty state-of-the-art clustering algorithms available in R language. An important advantage is that the input and output of clustering algorithms is simplified and consistent in order to enable users a swift execution of cluster analysis. By combining mirrored-density plots (MD plots) with statistical testing FCPS provides a tool to investigate the cluster tendency quickly prior to the cluster analysis itself
.
Common clustering challenges can be generated with arbitrary sample size
.
Additionally, FCPS sums 26 indicators with the goal to estimate the number of clusters up and provides an appropriate implementation of the clustering accuracy for more than two clusters
.
A subset of methods was used in a benchmarking of algorithms published in
.
Installation
Installation using CRAN
Install automatically with all dependencies via
install.packages("FCPS",dependencies = T)

# Optionally, for the automatic installation
# of all suggested packages:
Suggested=c("kernlab", "cclust", "dbscan", "kohonen",
            "MCL", "ADPclust", "cluster", "DatabionicSwarm",
            "orclus", "subspace", "flexclust", "ABCanalysis",
            "apcluster", "pracma", "EMCluster", "pdfCluster", "parallelDist",
            "plotly", "ProjectionBasedClustering", "GeneralizedUmatrix",
            "mstknnclust", "densityClust", "parallel", "energy", "R.utils",
            "tclust", "Spectrum", "genie", "protoclust", "fastcluster",
			"clusterability", "signal", "reshape2", "PPCI", "clustrd", "smacof",
			"rgl", "prclust", "dendextend",
            "moments", "prabclus", "VarSelLCM", "sparcl", "mixtools",
            "HDclassif", "clustvarsel", "knitr", "rmarkdown")

for(i in 1:length(Suggested)) {
  if (!requireNamespace(Suggested[i], quietly = TRUE)) {
    message(paste("Installing the package", Suggested[i]))
    install.packages(Suggested[i], dependencies = T)
  }
}
Installation using Github
Please note, that dependecies have to be installed manually.
remotes::install_github("Mthrun/FCPS")
Installation using R Studio
Please note, that dependecies have to be installed manually.
Tools -> Install Packages -> Repository (CRAN) -> FCPS
Tutorial Examples
The tutorial with several examples can be found on in the vignette on CRAN:
https://cran.r-project.org/web/packages/FCPS/vignettes/FCPS.html
Manual
The full manual for users or developers is available here: https://cran.r-project.org/web/packages/FCPS/FCPS.pdf
Use Cases
Cluster Analysis of High-dimensional Data
The package FCPS provides a clear and consistent access to state-of-the-art clustering algorithms:
library(FCPS)
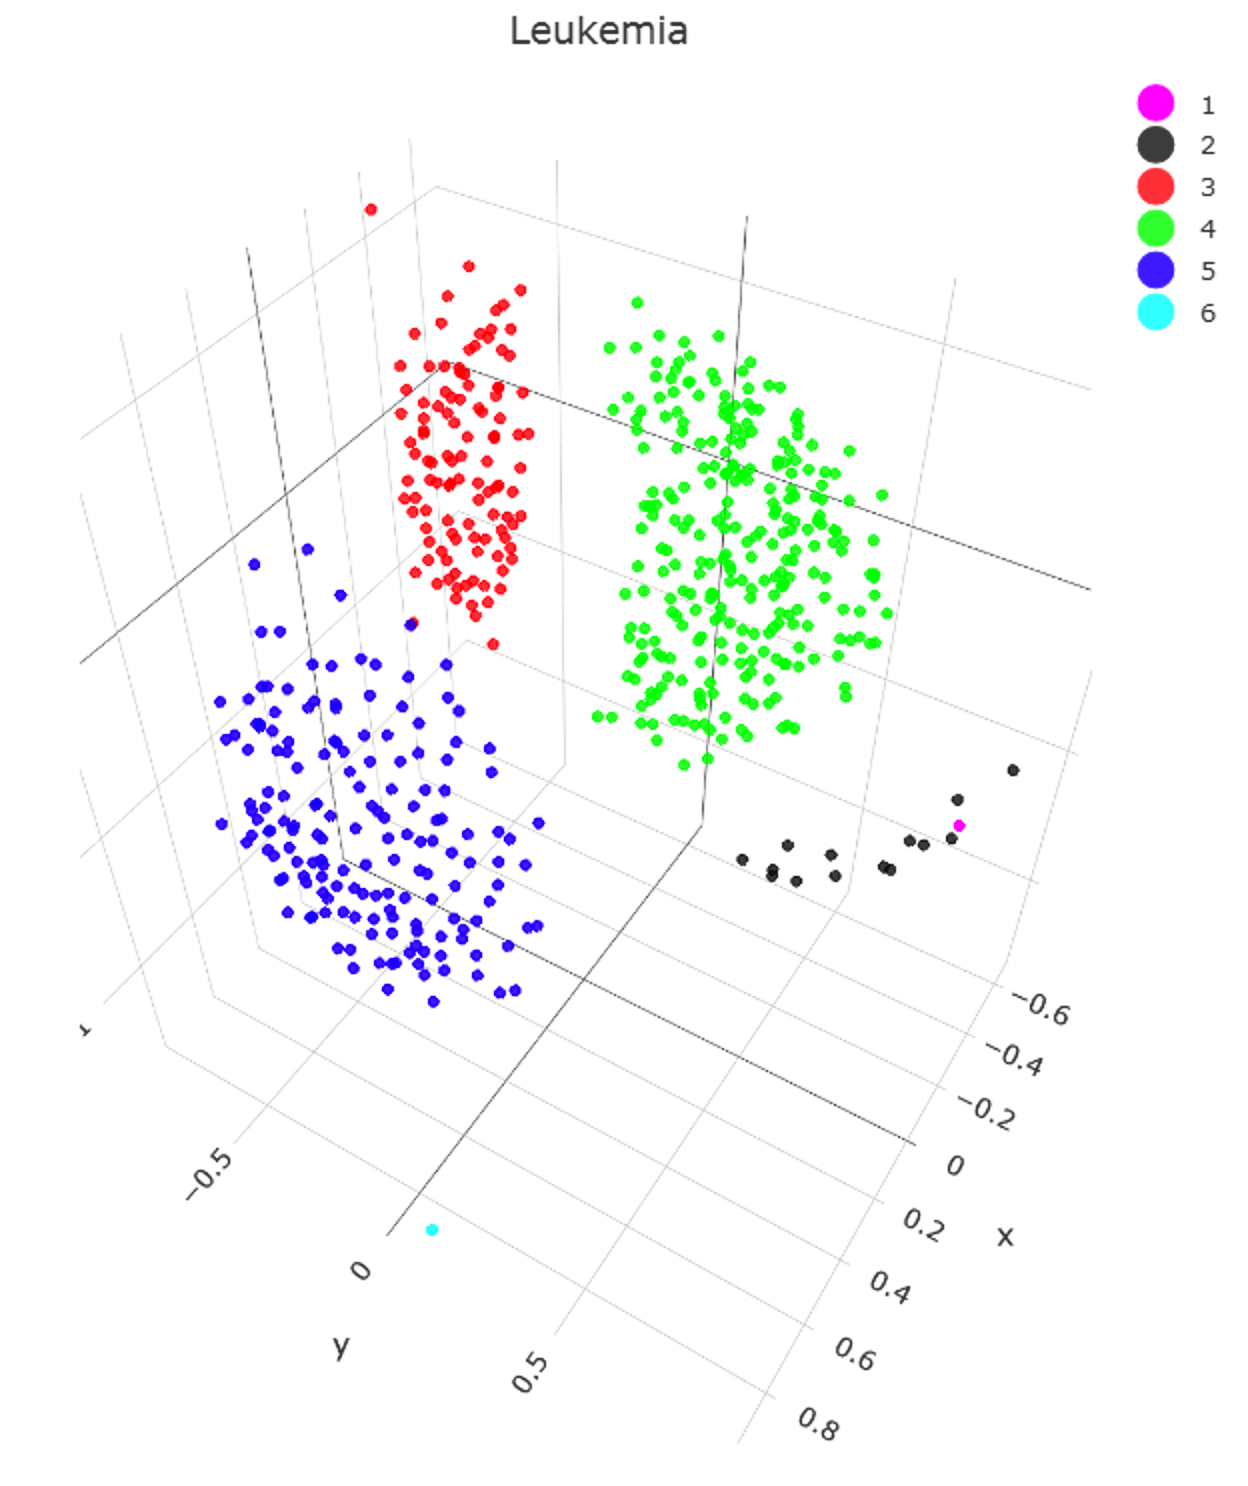
data("Leukemia")
Data=Leukemia$Distance
Classification=Leukemia$Cls
ClusterNo=6
CA=ADPclustering(Leukemia$DistanceMatrix,ClusterNo)
Cls=ClusterRenameDescendingSize(CA$Cls)
ClusterPlotMDS(Data,Cls,main = ’Leukemia’,Plotter3D = ’plotly’)
ClusterAccuracy(Cls,Classification)
[1] 0.9963899
Generating Typical Challenges for Clustering Algorithms
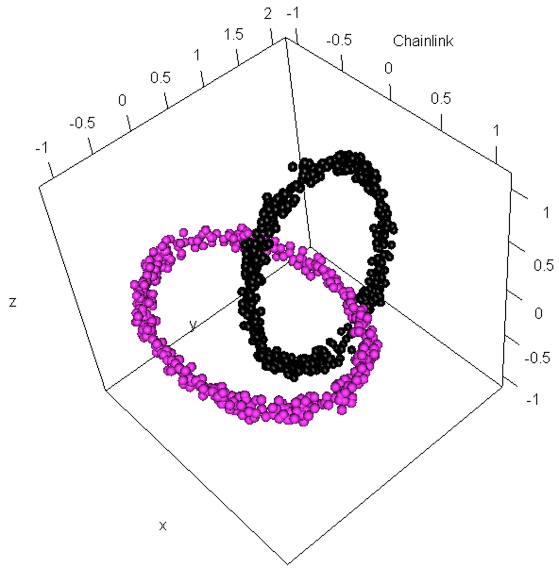
Several clustering challenge can be generated with an arbitrary sample size:
set.seed(600)
library(FCPS)
DataList=ClusterChallenge("Chainlink", SampleSize = 750,
PlotIt=TRUE)
Data=DataList$Chainlink
Cls=DataList$Cls
> ClusterCount(Cls)
$CountPerCluster
$NumberOfClusters
$ClusterPercentages
[1] 377 373
[1] 2
[1] 50.26667 49.73333
Cluster-Tendency
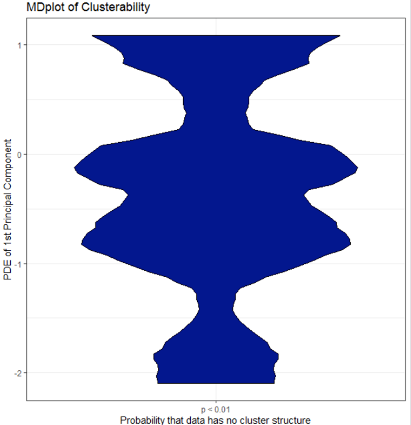
For many applications, it is crucial to decide if a dataset possesses cluster structures:
library(FCPS)
set.seed(600)
DataList=ClusterChallenge("Chainlink",SampleSize = 750)
Data=DataList$Chainlink
Cls=DataList$Cls
library(ggplot2)
ClusterabilityMDplot(Data)+theme_bw()
Estimation of Number of Clusters
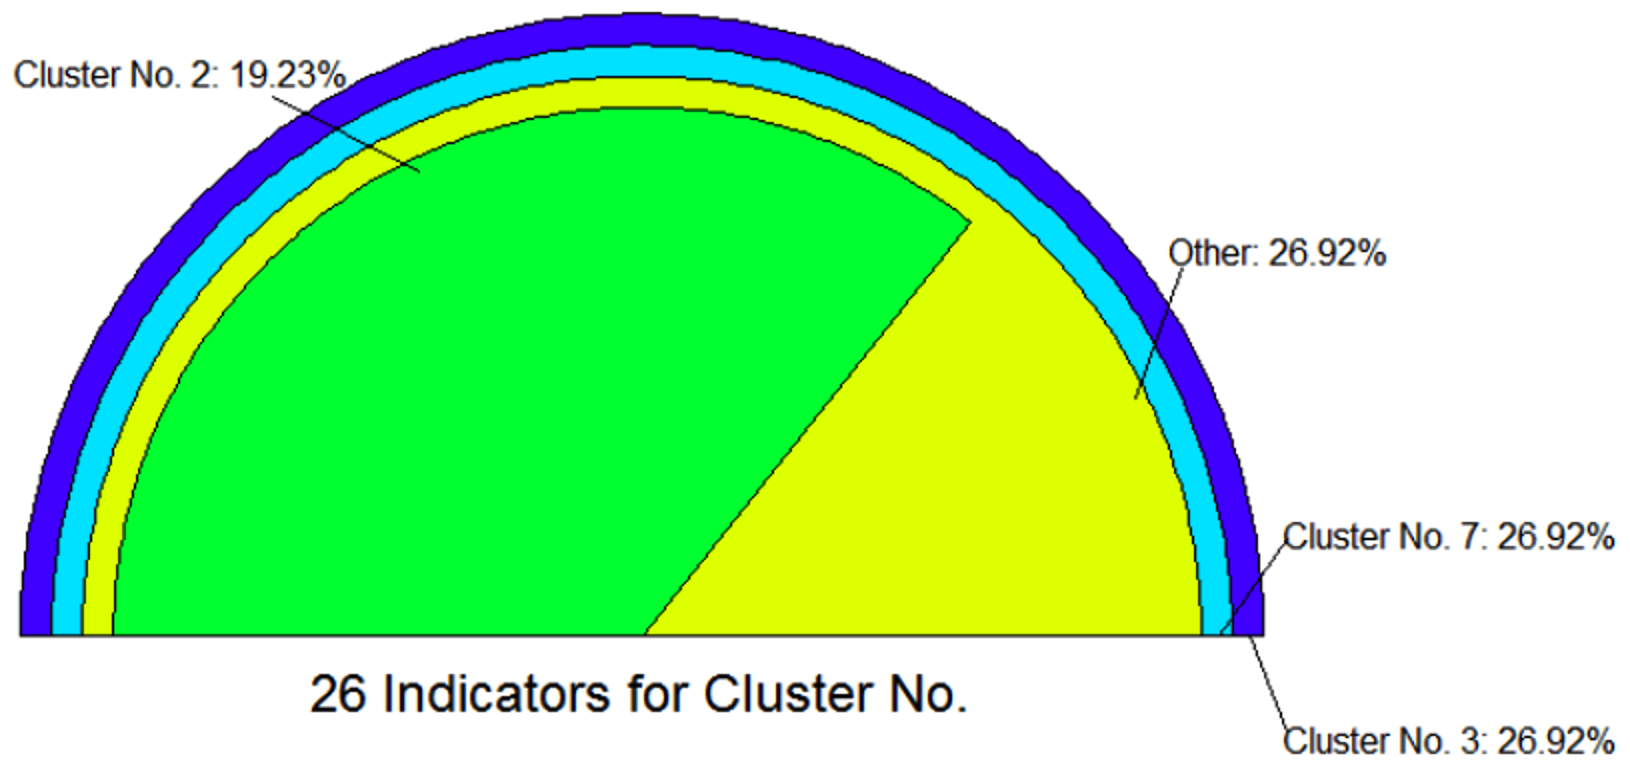
The “FCPS” package provides up to 26 indicators to determine the number of clusters:
library(FCPS)
set.seed(135)
DataList=ClusterChallenge("Chainlink",SampleSize = 900)
Data=DataList$Chainlink
Cls=DataList$Cls
Tree=HierarchicalClustering(Data,0,"SingleL")[[3]]
ClusterDendrogram(Tree,4,main="Single Linkage")
MaximumNumber=7
clsm <- matrix(data = 0, nrow = dim(Data)[1], ncol = MaximumNumber)
for (i in 2:(MaximumNumber+1)) {
clsm[,i-1] <- cutree(Tree,i)
}
out=ClusterNoEstimation(Data, ClsMatrix = clsm,
MaxClusterNo = MaximumNumber, PlotIt = TRUE)
Additional information
| Authors website | http://www.deepbionics.org/ |
|---|---|
| License | GPL-3 |
| Dependencies | R (>= 3.5.0) |
| Bug reports | https://github.com/Mthrun/FCPS/issues |
References
- [Thrun/Stier, 2021] Thrun, M. C., & Stier, Q.: Fundamental Clustering Algorithms Suite SoftwareX, Vol. 13(C), pp. 100642. doi 10.1016/j.softx.2020.100642, 2021.
- [Thrun, 2020] Thrun, M. C.: Improving the Sensitivity of Statistical Testing for Clusterability with Mirrored-Density Plot, in Archambault, D., Nabney, I. & Peltonen, J. (eds.), Machine Learning Methods in Visualisation for Big Data, DOI 10.2312/mlvis.20201102, The Eurographics Association, Norrköping , Sweden, May, 2020.
- [Thrun/Ultsch, 2020a] Thrun, M. C., & Ultsch, A.: Clustering Benchmark Datasets Exploiting the Fundamental Clustering Problems, Data in Brief,Vol. 30(C), pp. 105501, DOI 10.1016/j.dib.2020.105501 , 2020.
- [Thrun/Ultsch, 2021] Thrun, M. C., and Ultsch, A.: Swarm Intelligence for Self-Organized Clustering, Artificial Intelligence, Vol. 290, pp. 103237, \doi{10.1016/j.artint.2020.103237}, 2021.
- [Thrun/Ultsch, 2020b] Thrun, M. C., & Ultsch, A. : Using Projection based Clustering to Find Distance and Density based Clusters in High-Dimensional Data, Journal of Classification, \doi{10.1007/s00357-020-09373-2}, Springer, 2020.