shinymodels
Interactive Assessments of Models
Launch a 'shiny' application for 'tidymodels' results. For classification or regression models, the app can be used to determine if there is lack of fit or poorly predicted points.
shinymodels



The goal of shinymodels is to launch a Shiny app given tidymodels’ tuning or resampling results, to make it easier to explore the modeling results.
Installation
You can install the released version of shinymodels from CRAN with:
install.packages("shinymodels")
And the development version from GitHub with:
# install.packages("pak")
pak::pak("tidymodels/shinymodels")
Example
Start by tuning or fitting to resampling folds, using tune functions
like fit_resamples() or tune_bayes().
As an example, we will simulate a simple relationship:
library(shinymodels)
library(tidymodels)
tidymodels_prefer()

set.seed(1)
n <- 100
simulated <-
  data.frame(x1 = runif(n, min = -1), x2 = runif(n)) %>%
  mutate(y = 3 - 5 * x1 + 15 * x1^2 +  + 10 * x2 + rnorm(n, sd = 5))
Let’s resample a linear regression model that is missing an important
nonlinear term (i.e., poly(x1, 2)):
set.seed(2)
folds <- vfold_cv(simulated)

reg_res <-
  linear_reg() %>%
  fit_resamples(y ~ .,
                resamples = folds,
                control = control_resamples(save_pred = TRUE))
To interactively assess the model fit, we can use the explore()
function:
explore(reg_res)
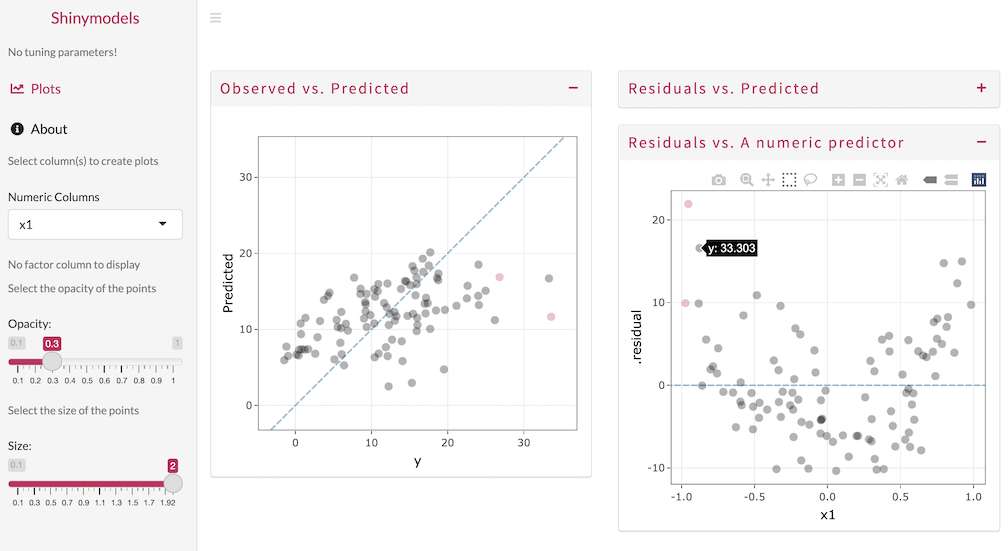
Use the Shiny app to explore the model results and detect any outliers
or problematic observations. In the image below, the observed and
predicted values are visualized, with one sample selected and
highlighted. The residuals are also plotted against x1 and the
quadratic pattern shows that a nonlinear term should be added.
The explore() function can be used with objects produced by
fit_resamples(), last_fit(), or any of the tune_*() functions.
Contributing
This project is released with a Contributor Code of Conduct. By contributing to this project, you agree to abide by its terms.
-
For questions and discussions about tidymodels packages, modeling, and machine learning, please post on RStudio Community.
-
If you think you have encountered a bug, please submit an issue.
-
Either way, learn how to create and share a reprex (a minimal, reproducible example), to clearly communicate about your code.
-
Check out further details on contributing guidelines for tidymodels packages and how to get help.