BayesERtools
Bayesian Exposure-Response Analysis Tools
Suite of tools that facilitate exposure-response analysis using Bayesian methods. The package provides a streamlined workflow for fitting types of models that are commonly used in exposure-response analysis - linear and Emax for continuous endpoints, logistic linear and logistic Emax for binary endpoints, as well as performing simulation and visualization. Learn more about the workflow at < https://genentech.github.io/BayesERbook/>.
BayesERtools 


BayesERtools provides a suite of tools that facilitate
exposure-response analysis using Bayesian methods.
- Tutorial (
BayesERbook): https://genentech.github.io/BayesERbook/ - Package documentation: https://genentech.github.io/BayesERtools/
- GitHub repo of the package: https://github.com/genentech/BayesERtools/
Installation
You can install the BayesERtools with:
install.packages('BayesERtools')
# devtools::install_github("genentech/BayesERtools") # development version
Supported model types
|
Binary endpoint
|
Continuous endpoint
|
|||
|---|---|---|---|---|
| Linear (logit) | Emax (logit) | Linear | Emax | |
| backend | rstanarm |
rstanemax |
rstanarm |
rstanemax |
| reference | 🔗 | 🔗 | 🔗 | 🔗 |
| develop model | ✅ | ✅ | ✅ | ✅ |
| simulate & plot ER | ✅ | ✅ | ✅ | ✅ |
| exposure metrics selection | ✅ | ✅ | ✅ | ✅ |
| covariate selection | ✅ | ❌ | ✅ | ❌ |
| covariate forest plot | ✅ | ❌ | ✅ | ❌ |
| ✅ Available, 🟡 In plan/under development, ❌ Not in a current plan |
Quick guide
Here is a quick demo on how to use this package for E-R analysis. See Basic workflow for more thorough walk through.
# Load package and data
library(dplyr)
library(BayesERtools)
theme_set(theme_bw(base_size = 12))

data(d_sim_binom_cov)

# Hyperglycemia Grade 2+ (hgly2) data
df_er_ae_hgly2 <-
  d_sim_binom_cov |>
  filter(AETYPE == "hgly2") |>
  # Re-scale AUCss, baseline age
  mutate(
    AUCss_1000 = AUCss / 1000, BAGE_10 = BAGE / 10,
    Dose = paste(Dose_mg, "mg")
  )

var_resp <- "AEFLAG"
Simple univariable model for binary endpoint
set.seed(1234)
ermod_bin <- dev_ermod_bin(
  data = df_er_ae_hgly2,
  var_resp = var_resp,
  var_exposure = "AUCss_1000"
)
ermod_bin
#>
#> ── Binary ER model ─────────────────────────────────────────────────────────────
#> ℹ Use `plot_er()` to visualize ER curve
#>
#> ── Developed model ──
#>
#> stan_glm
#>  family:       binomial [logit]
#>  formula:      AEFLAG ~ AUCss_1000
#>  observations: 500
#>  predictors:   2
#> ------
#>             Median MAD_SD
#> (Intercept) -2.04   0.23
#> AUCss_1000   0.41   0.08
#> ------
#> * For help interpreting the printed output see ?print.stanreg
#> * For info on the priors used see ?prior_summary.stanreg

# Using `*` instead of `+` so that scale can be
# applied for both panels (main plot and boxplot)
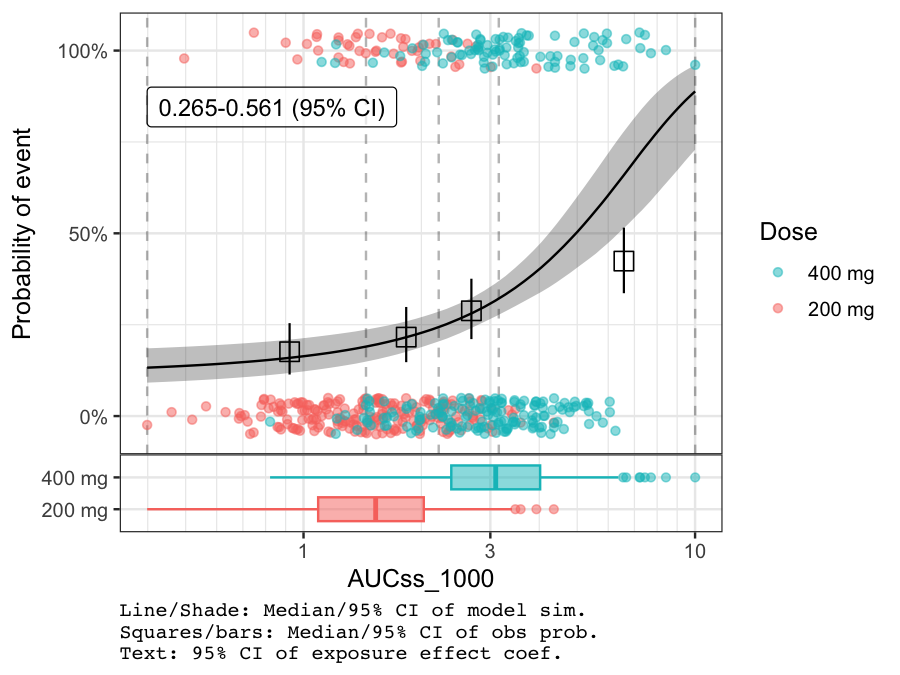
plot_er_gof(ermod_bin, var_group = "Dose", show_coef_exp = TRUE) *
  coord_transform(x = "log10") *
  scale_x_continuous(
    breaks = xgxr::xgx_breaks_log10,
    minor_breaks = xgxr::xgx_minor_breaks_log10
  )
Covariate selection
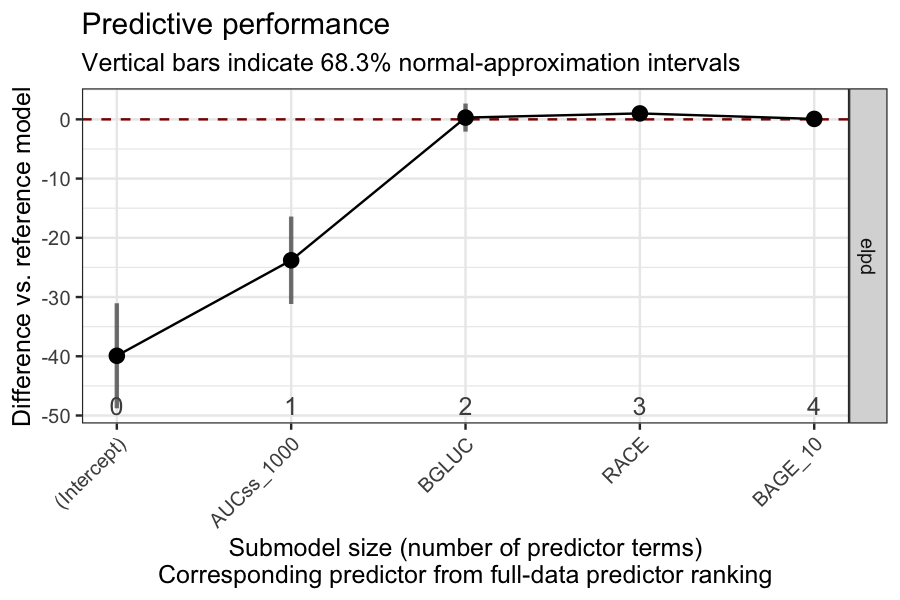
BGLUC (baseline glucose) is selected while other two covariates are not.
set.seed(1234)
ermod_bin_cov_sel <-
  dev_ermod_bin_cov_sel(
    data = df_er_ae_hgly2,
    var_resp = var_resp,
    var_exposure = "AUCss_1000",
    var_cov_candidate = c("BAGE_10", "RACE", "BGLUC")
  )
#>
#> ── Step 1: Full reference model fit ──
#>
#> ── Step 2: Variable selection ──
#>
#> ℹ The variables selected were: AUCss_1000, BGLUC
#>
#> ── Step 3: Final model fit ──
#>
#> ── Cov mod dev complete ──
#>
ermod_bin_cov_sel
#> ── Binary ER model & covariate selection ───────────────────────────────────────
#> ℹ Use `plot_submod_performance()` to see variable selection performance
#> ℹ Use `plot_er()` with `marginal = TRUE` to visualize marginal ER curve
#>
#> ── Selected model ──
#>
#> stan_glm
#>  family:       binomial [logit]
#>  formula:      AEFLAG ~ AUCss_1000 + BGLUC
#>  observations: 500
#>  predictors:   3
#> ------
#>             Median MAD_SD
#> (Intercept) -7.59   0.90
#> AUCss_1000   0.46   0.08
#> BGLUC        0.87   0.13
#> ------
#> * For help interpreting the printed output see ?print.stanreg
#> * For info on the priors used see ?prior_summary.stanreg
plot_submod_performance(ermod_bin_cov_sel)
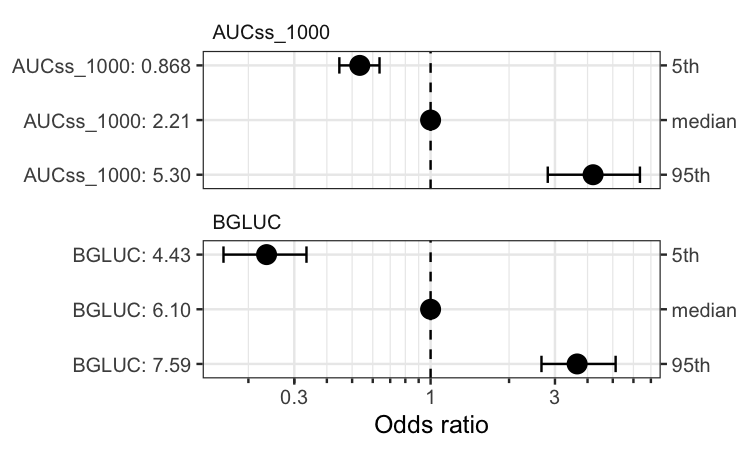
coveffsim <- sim_coveff(ermod_bin_cov_sel)
plot_coveff(coveffsim)