tidycomm
Data Modification and Analysis for Communication Research
Provides convenience functions for common data modification
and analysis tasks in communication research. This includes functions
for univariate and bivariate data analysis, index generation and
reliability computation, and intercoder reliability tests. All
functions follow the style and syntax of the tidyverse, and are
construed to perform their computations on multiple variables at once.
Functions for univariate and bivariate data analysis comprise summary
statistics for continuous and categorical variables, as well as
several tests of bivariate association including effect sizes.
Functions for data modification comprise index generation and
automated reliability analysis of index variables. Functions for
intercoder reliability comprise tests of several intercoder
reliability estimates, including simple and mean pairwise percent
agreement, Krippendorff's Alpha (Krippendorff 2004, ISBN:
9780761915454), and various Kappa coefficients (Brennan & Prediger
1981
tidycomm 


Tidycomm provides convenience functions for common tasks in communication research. All functions follow the style and syntax of the tidyverse.
Currently, tidycomm includes functions for various methods of univariate and bivariate data description and analysis, data modification, visualization, and intercoder reliability tests.
Installation
Install tidycomm from CRAN:
install.packages("tidycomm")
Or install the most recent development version of tidycomm with:
# install.packages("pak")
pak::pak("tidycomm/tidycomm")
Usage
library(tidycomm)
tidycomm functions follow the style and syntax of the tidyverse functions:
- they always assume a
tibbleas their first argument - they will always return a
tibbleas well, so they can be easily integrated into pipes - data variables (
tibblecolumns) are passed to function calls directly as symbols
WoJ %>% # Worlds of Journalism sample data
  describe(autonomy_selection, autonomy_emphasis)
#> # A tibble: 2 × 15
#>   Variable             N Missing     M    SD   Min   Q25   Mdn   Q75   Max Range
#> * <chr>            <int>   <int> <dbl> <dbl> <dbl> <dbl> <dbl> <dbl> <dbl> <dbl>
#> 1 autonomy_select…  1197       3  3.88 0.803     1     4     4     4     5     4
#> 2 autonomy_emphas…  1195       5  4.08 0.793     1     4     4     5     5     4
#> # ℹ 4 more variables: CI_95_LL <dbl>, CI_95_UL <dbl>, Skewness <dbl>,
#> #   Kurtosis <dbl>
Most functions will automatically use all relevant variables in the data
if no variables are specified in the function call. For example, to
compute descriptive statistics for all numeric variables in the data,
just call describe() without further arguments:
WoJ %>%
  describe()
#> # A tibble: 11 × 15
#>    Variable           N Missing     M     SD   Min   Q25   Mdn   Q75   Max Range
#>  * <chr>          <int>   <int> <dbl>  <dbl> <dbl> <dbl> <dbl> <dbl> <dbl> <dbl>
#>  1 autonomy_sele…  1197       3  3.88  0.803     1  4        4     4     5     4
#>  2 autonomy_emph…  1195       5  4.08  0.793     1  4        4     5     5     4
#>  3 ethics_1        1200       0  1.63  0.892     1  1        1     2     5     4
#>  4 ethics_2        1200       0  3.21  1.26      1  2        4     4     5     4
#>  5 ethics_3        1200       0  2.39  1.13      1  2        2     3     5     4
#>  6 ethics_4        1200       0  2.58  1.25      1  1.75     2     4     5     4
#>  7 work_experien…  1187      13 17.8  10.9       1  8       17    25    53    52
#>  8 trust_parliam…  1200       0  3.05  0.811     1  3        3     4     5     4
#>  9 trust_governm…  1200       0  2.82  0.854     1  2        3     3     5     4
#> 10 trust_parties   1200       0  2.42  0.736     1  2        2     3     4     3
#> 11 trust_politic…  1200       0  2.52  0.712     1  2        3     3     4     3
#> # ℹ 4 more variables: CI_95_LL <dbl>, CI_95_UL <dbl>, Skewness <dbl>,
#> #   Kurtosis <dbl>
Likewise, compute intercoder reliability tests for all variables by only specifying the post and coder ID variables:
fbposts %>% # Facebook post codings sample data
  test_icr(post_id, coder_id)
#> # A tibble: 5 × 8
#>   Variable     n_Units n_Coders n_Categories Level   Agreement Holstis_CR
#> * <chr>          <int>    <int>        <int> <chr>       <dbl>      <dbl>
#> 1 type              45        6            4 nominal     1          1
#> 2 n_pictures        45        6            7 nominal     0.822      0.930
#> 3 pop_elite         45        6            6 nominal     0.733      0.861
#> 4 pop_people        45        6            2 nominal     0.778      0.916
#> 5 pop_othering      45        6            4 nominal     0.867      0.945
#> # ℹ 1 more variable: Krippendorffs_Alpha <dbl>
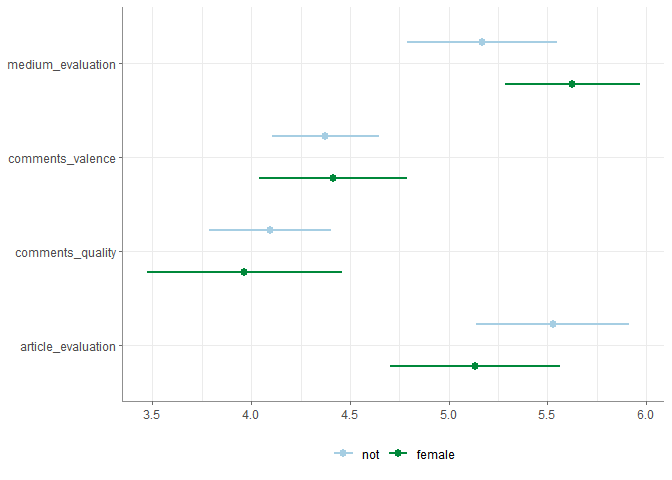
Almost all functions also come with integrated visualizations. So to
visualize your results you can easily just append visualize() to the
end of your commands:
snscomments %>% # experimental social-media-post perception sample data
  dplyr::filter(group == 3) %>%
  t_test(
    gender,
    medium_evaluation,
    article_evaluation,
    comments_quality,
    comments_valence
  ) %>%
  visualize()
For detailed examples, see the following articles: