NACHO
NanoString Quality Control Dashboard
NanoString nCounter data are gene expression assays
where there is no need for the use of enzymes or amplification
protocols and work with fluorescent barcodes (Geiss et al. (2018)
NAnoString quality Control dasHbOard 


Installation
# Install the release from CRAN:
install.packages("NACHO")

# Or install the development version from R-universe:
install.packages(
  "NACHO",
  repos = c("https://mcanouil.r-universe.dev", "https://cloud.r-project.org")
)

# Or install the latest commit from GitHub with pak:
# install.packages("pak")
pak::pak("mcanouil/NACHO")
Quick start
The package ships six samples of the public study GSE178516, so this
runs offline. load_rcc() reads the RCC files, computes the
quality-control metrics and normalises the counts.
library(NACHO)

data_directory <- system.file("extdata", "GSE178516", package = "NACHO")
nacho <- load_rcc(
  data_directory = data_directory,
  ssheet_csv = file.path(data_directory, "samplesheet.csv"),
  id_colname = "IDFILE",
  instrument = "max",
  n_comp = 5
)
#> ℹ Reading 6 RCC files
#> ✔ Reading 6 RCC files [25ms]
#>
#> ℹ Assembling 6 samples
#> ✔ Assembling 6 samples [18ms]
#>
#> ℹ Computing quality-control metrics and normalising
#> ✔ Computing quality-control metrics and normalising [24ms]
#>
nacho_qc(nacho)[, c("IDFILE", "status", "n_flags", "reason")]
#>                  IDFILE status n_flags reason
#> 1 GSM5393247_S02.RCC.gz   pass       0   <NA>
#> 2 GSM5393248_S13.RCC.gz   pass       0   <NA>
#> 3 GSM5393250_S15.RCC.gz   pass       0   <NA>
#> 4 GSM5393251_S16.RCC.gz   pass       0   <NA>
#> 5 GSM5393267_S46.RCC.gz   pass       0   <NA>
#> 6 GSM5393268_S47.RCC.gz   pass       0   <NA>
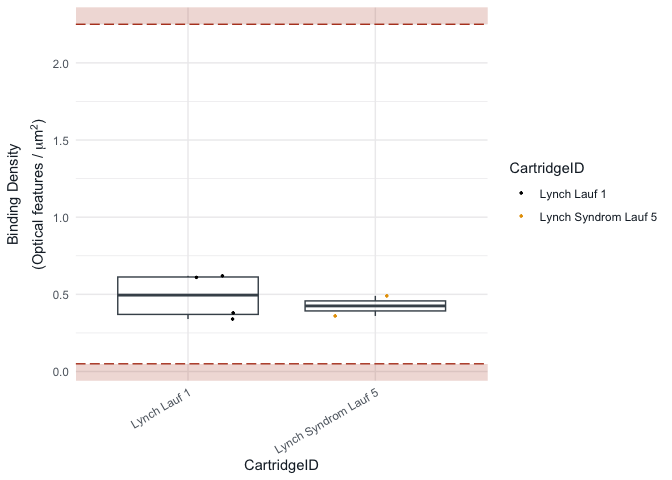
autoplot() draws any quality-control figure, render() writes a
report with Quarto, and visualise() opens the app.
autoplot(nacho, type = "BD")
render(nacho, output_dir = tempdir())
visualise(nacho)
Overview
NACHO works with NanoString nCounter data. It reads the RCC files, flags the samples that fail quality control and normalises the counts.
load_rcc()reads the RCC files and a sample sheet, computes the quality-control metrics and normalises the counts.visualise()opens a Shiny app to look at every metric and change the limits.autoplot()draws any quality-control figure as aggplot2plot.render()writes a quality-control report with Quarto, as an HTML or a PDF file.normalise()runs the normalisation again with new settings.
The package website shows the app, the report and a full analysis.
Shiny application
Open the app on a nacho object with visualise().
visualise(GSE74821)

The articles “Explore quality control in the app” and “Analyse a GEO study” on the package website show each page of the app and a full analysis of GSE178516. The article “Moving from NACHO 2” on the same website maps the NACHO 2 code to NACHO 3.
Citing NACHO
Canouil, M., Bouland, G. A., Bonnefond, A., Froguel, P., ’t Hart, L. M., & Slieker, R. C. (2020). “NACHO: an R package for quality control of NanoString nCounter data”. Bioinformatics, 36(3), 970-971. doi: 10.1093/bioinformatics/btz647
@Article{Canouil2020,
  title = {{NACHO}: an {R} package for quality control of {NanoString} {nCounter} data},
  author = {Mickaël Canouil and Gerard A. Bouland and Amélie Bonnefond and Philippe Froguel and Leen M. {'t Hart} and Roderick C. Slieker},
  journal = {Bioinformatics},
  year = {2020},
  month = {feb},
  volume = {36},
  number = {3},
  pages = {970--971},
  issn = {1367-4803},
  doi = {10.1093/bioinformatics/btz647},
}
Getting help
If you encounter a clear bug, please file a minimal reproducible example
on GitHub.
For questions and other discussion, please contact the package
maintainer.
Code of Conduct
Please note that this project is released with a Contributor Code of
Conduct.
By contributing to this project, you agree to abide by its terms.