sugarglider
Create Glyph-Maps of Spatiotemporal Data
Provides 'ggplot2' extensions to construct glyph-maps for visualizing seasonality in spatiotemporal data. See the Journal of Statistical Software reference: Zhang, H. S., Cook, D., Laa, U., Langrené, N., & Menéndez, P. (2024)
sugarglider 

Overview
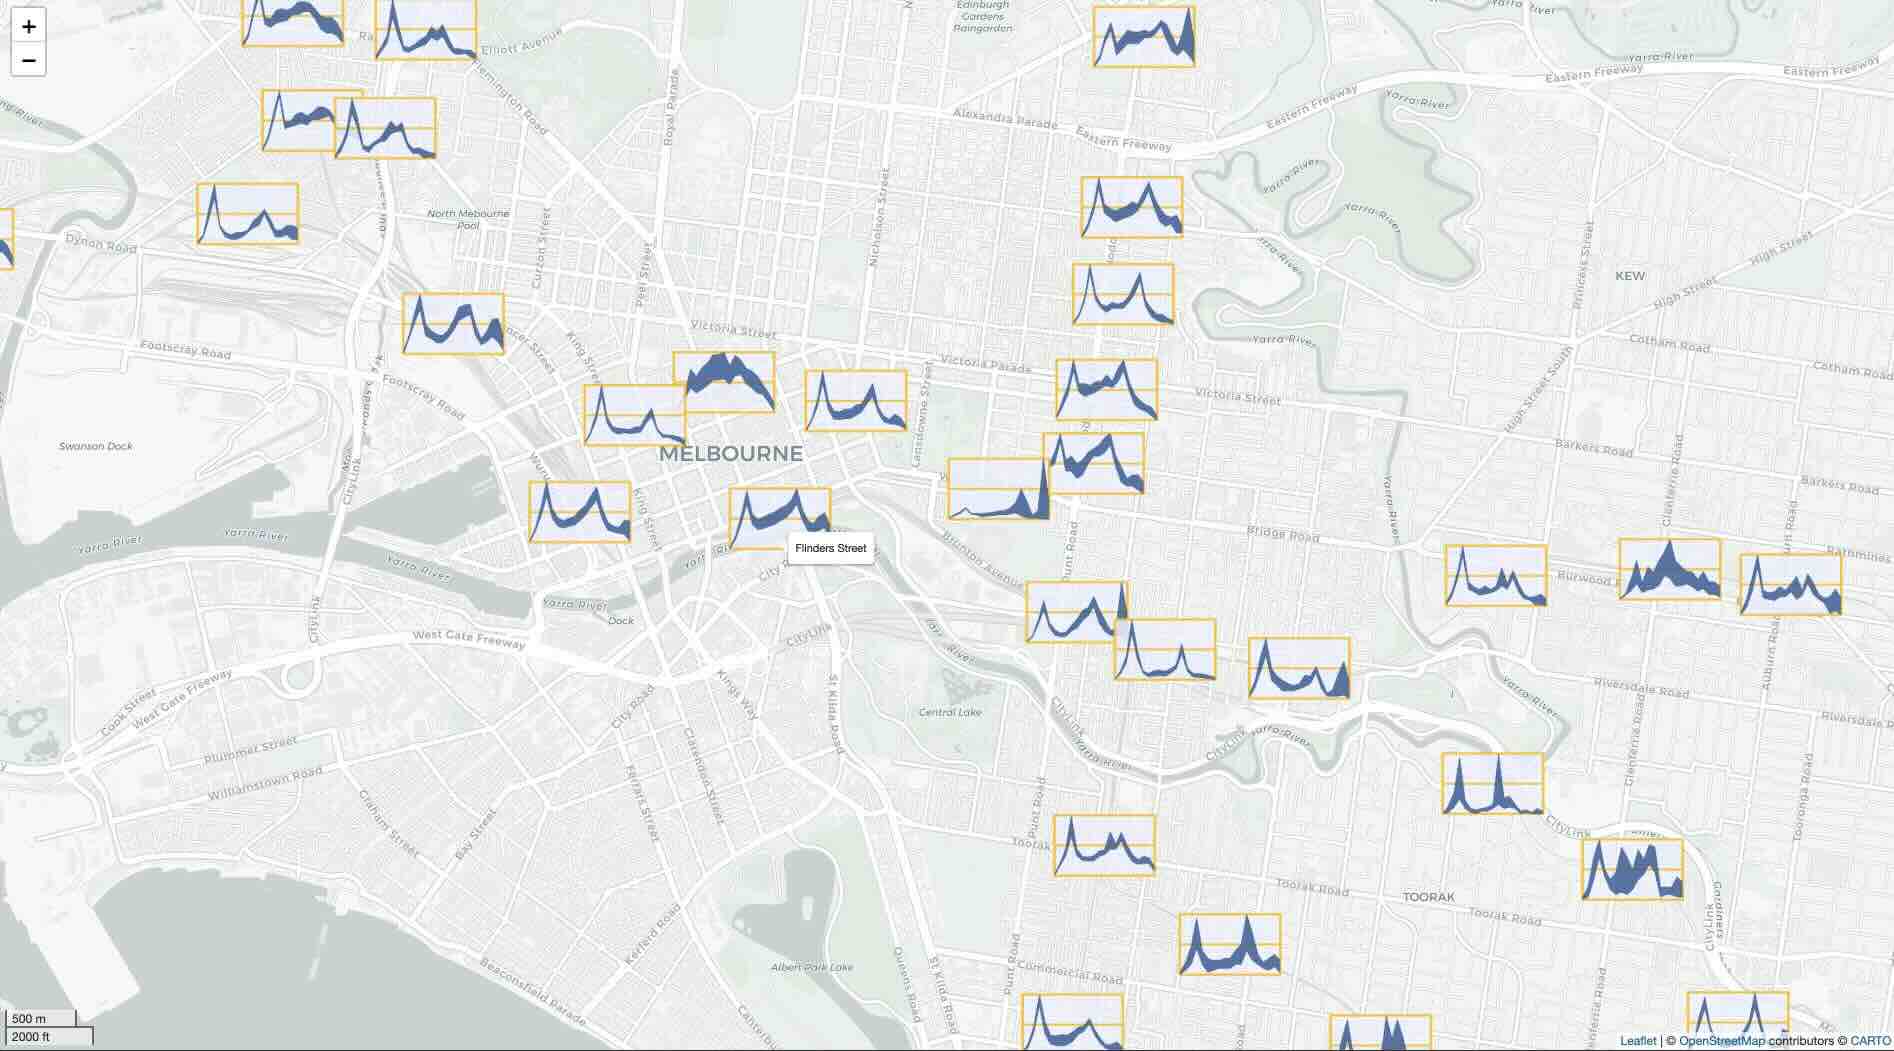
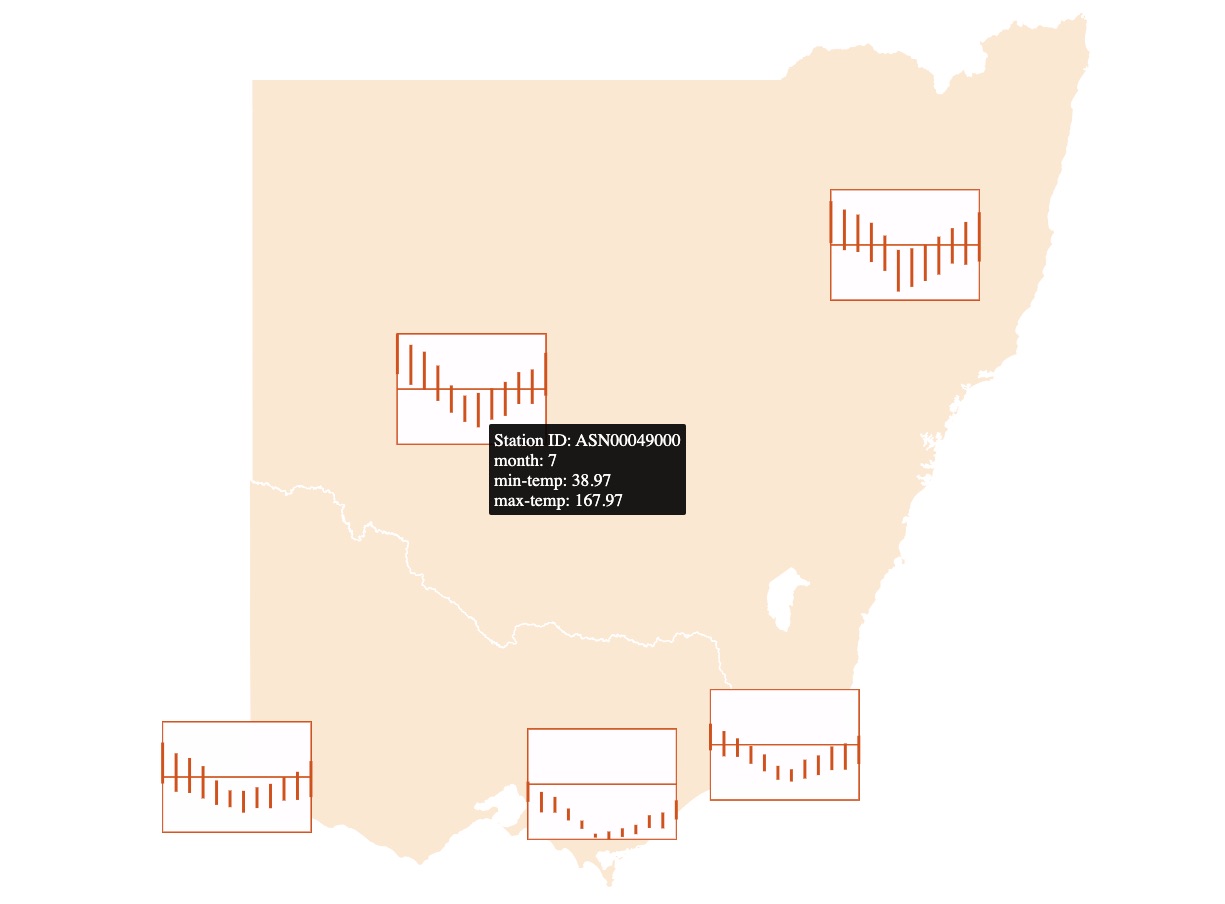
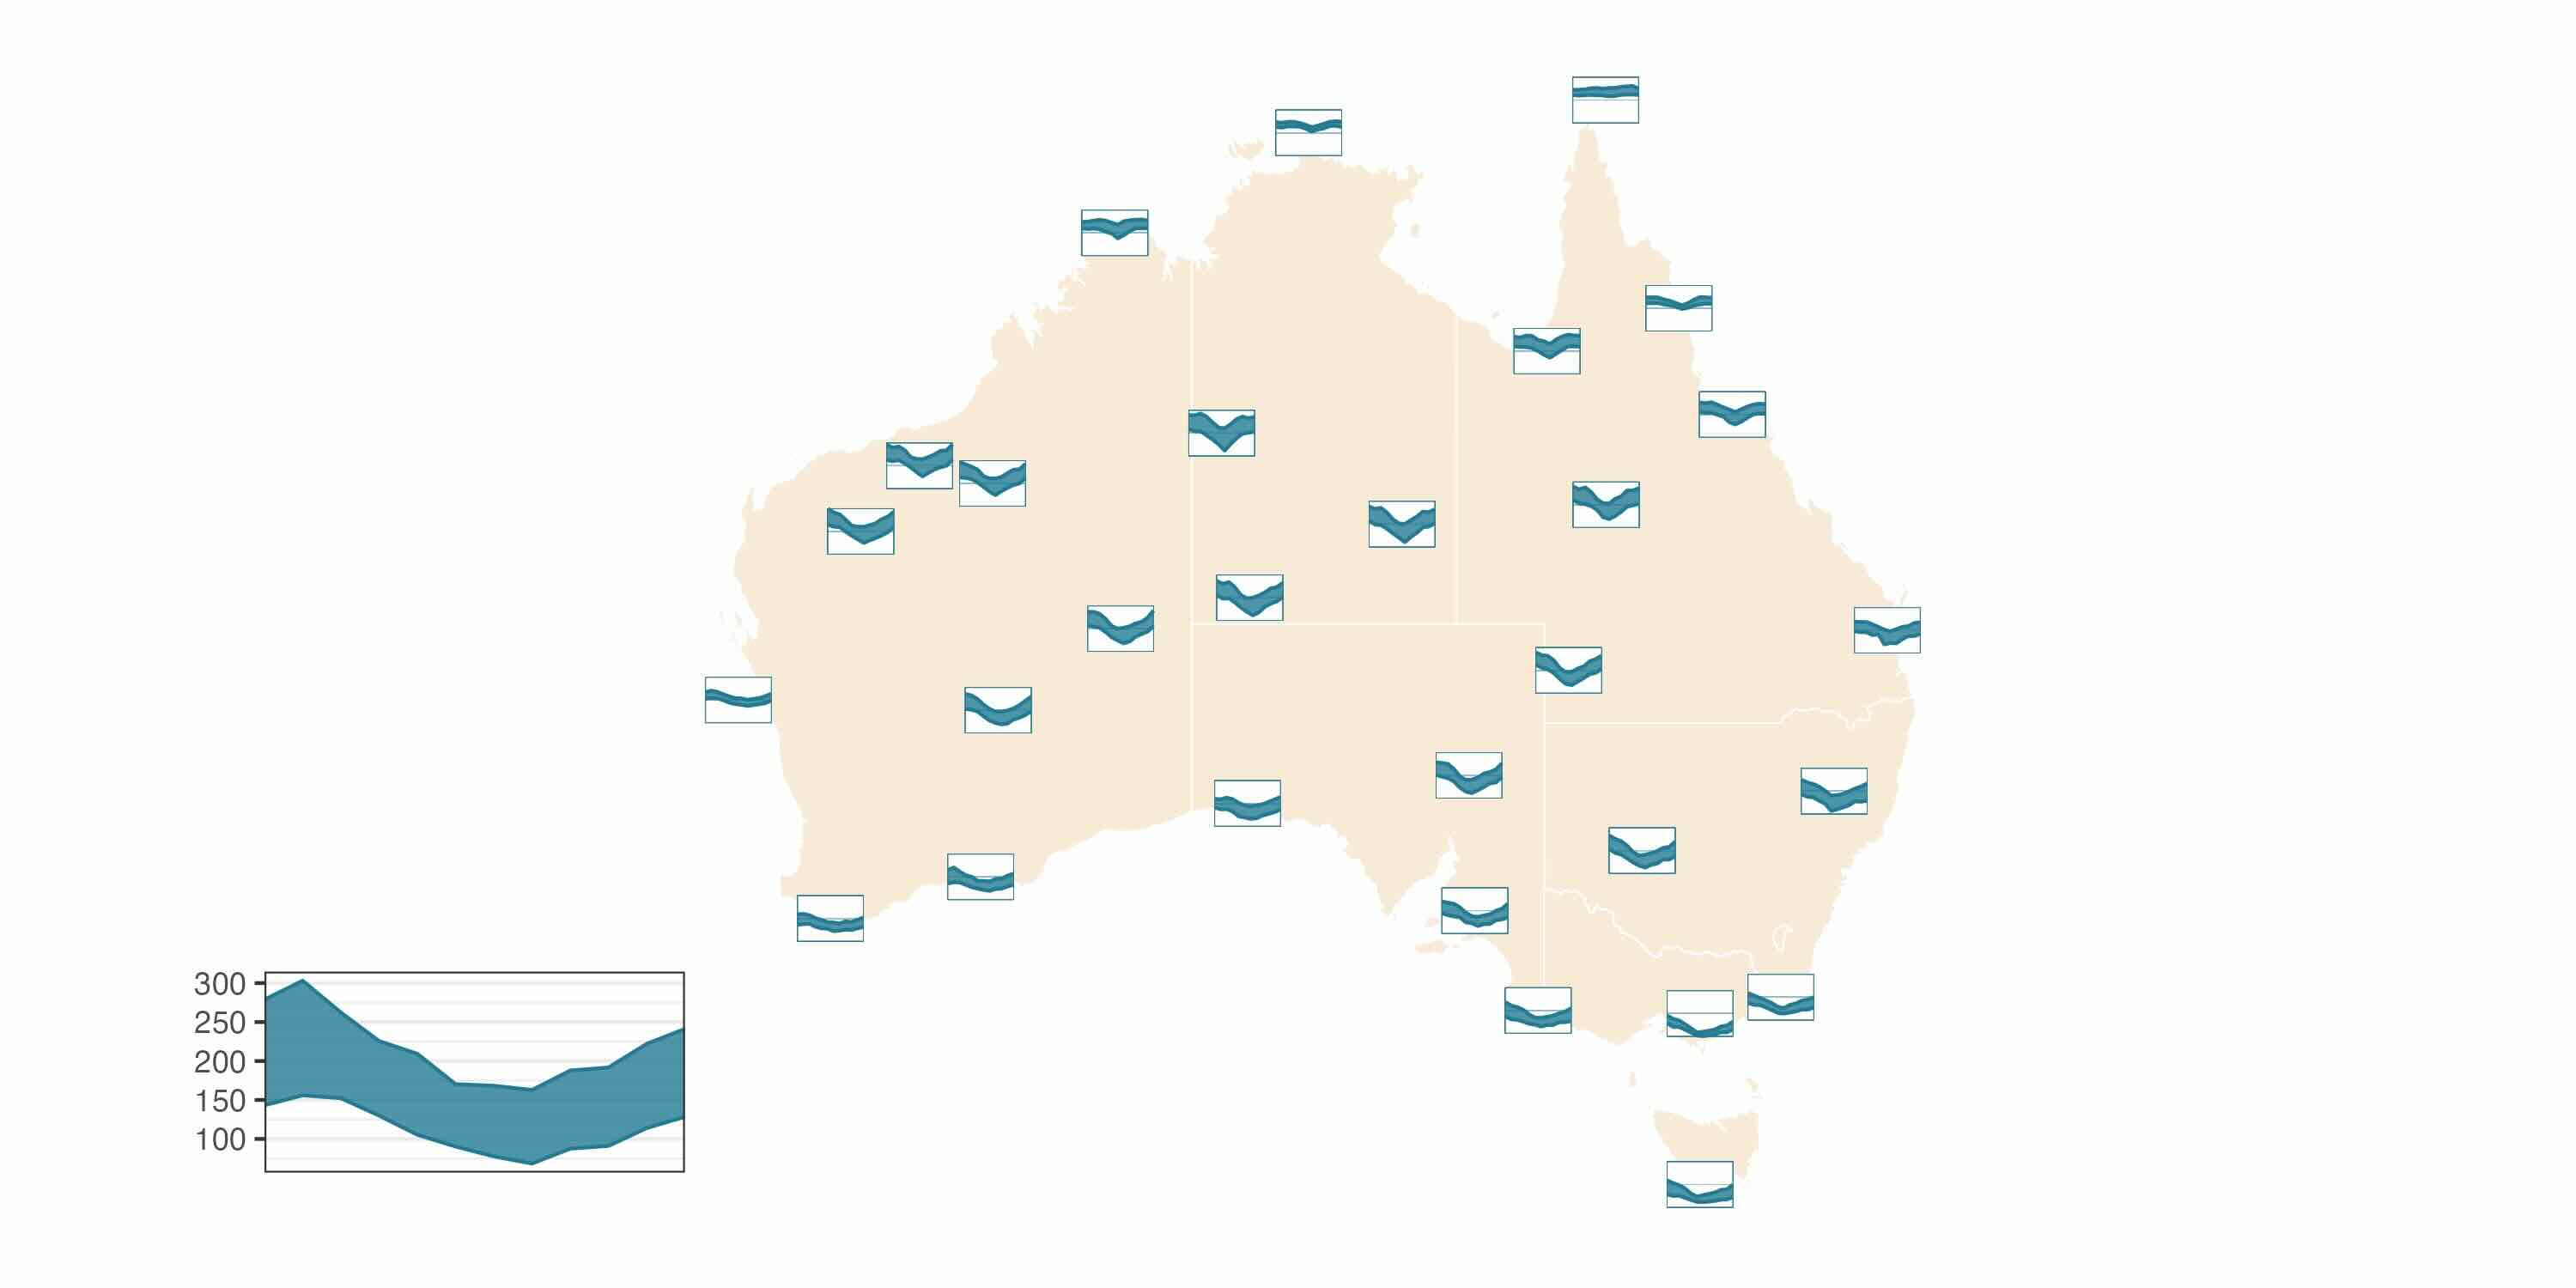
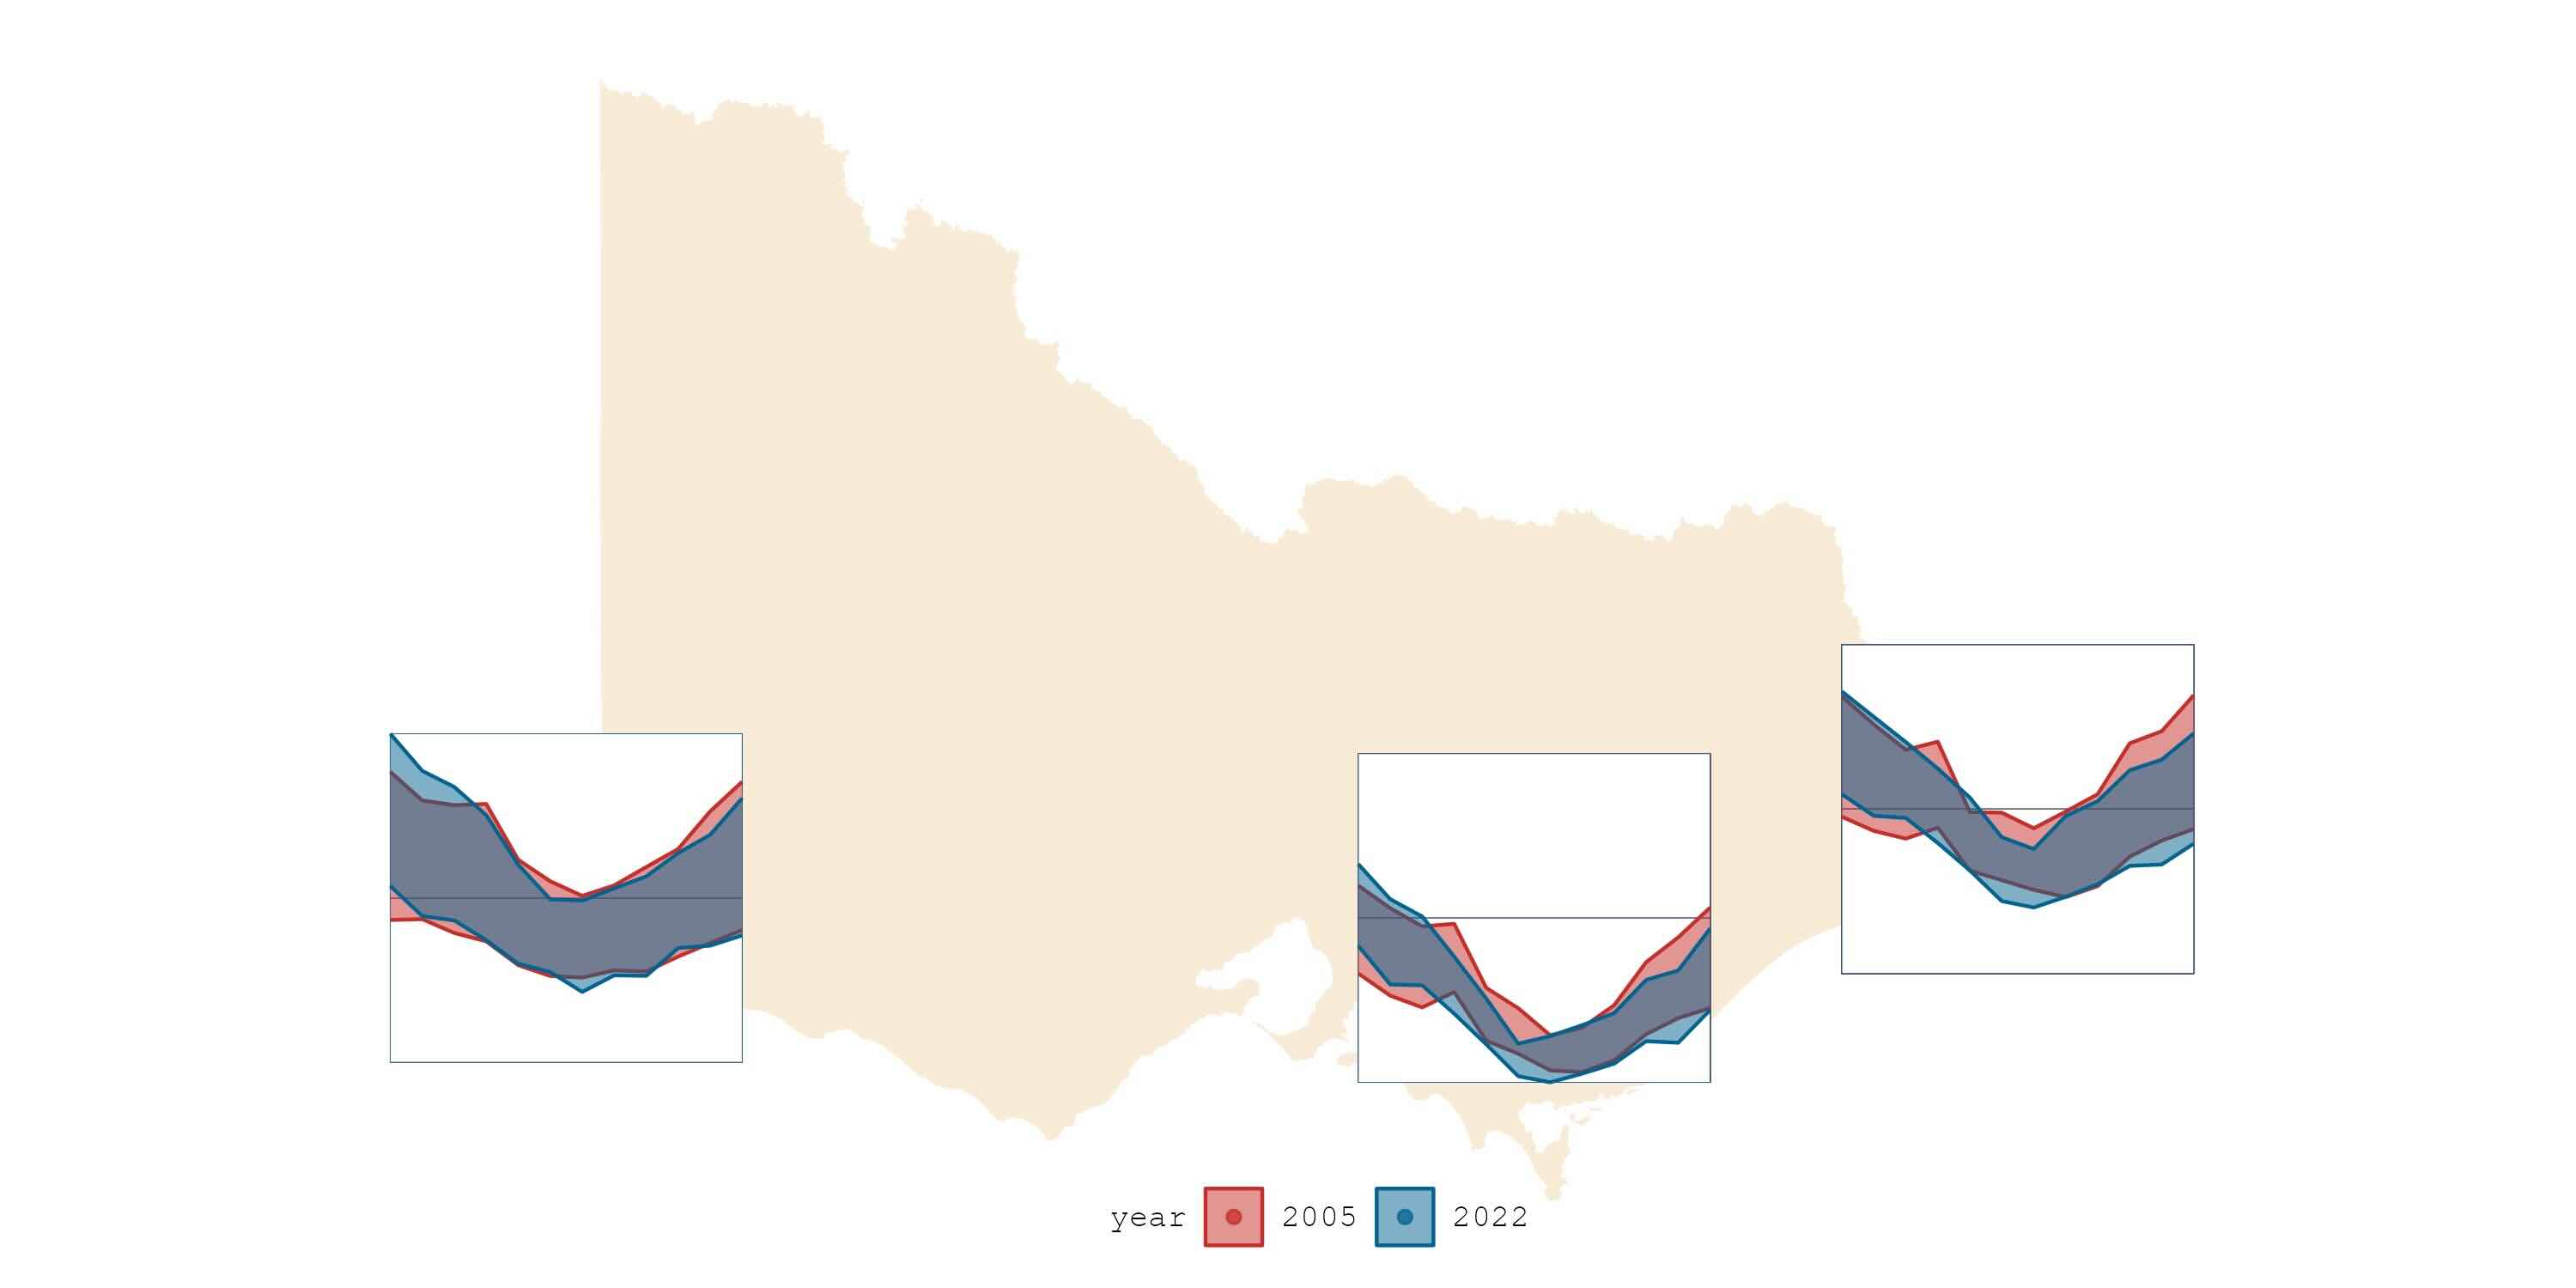
sugarglider provides ggplot2 extensions to create glyph maps that
visualize seasonal aspects of spatio-temporal data with
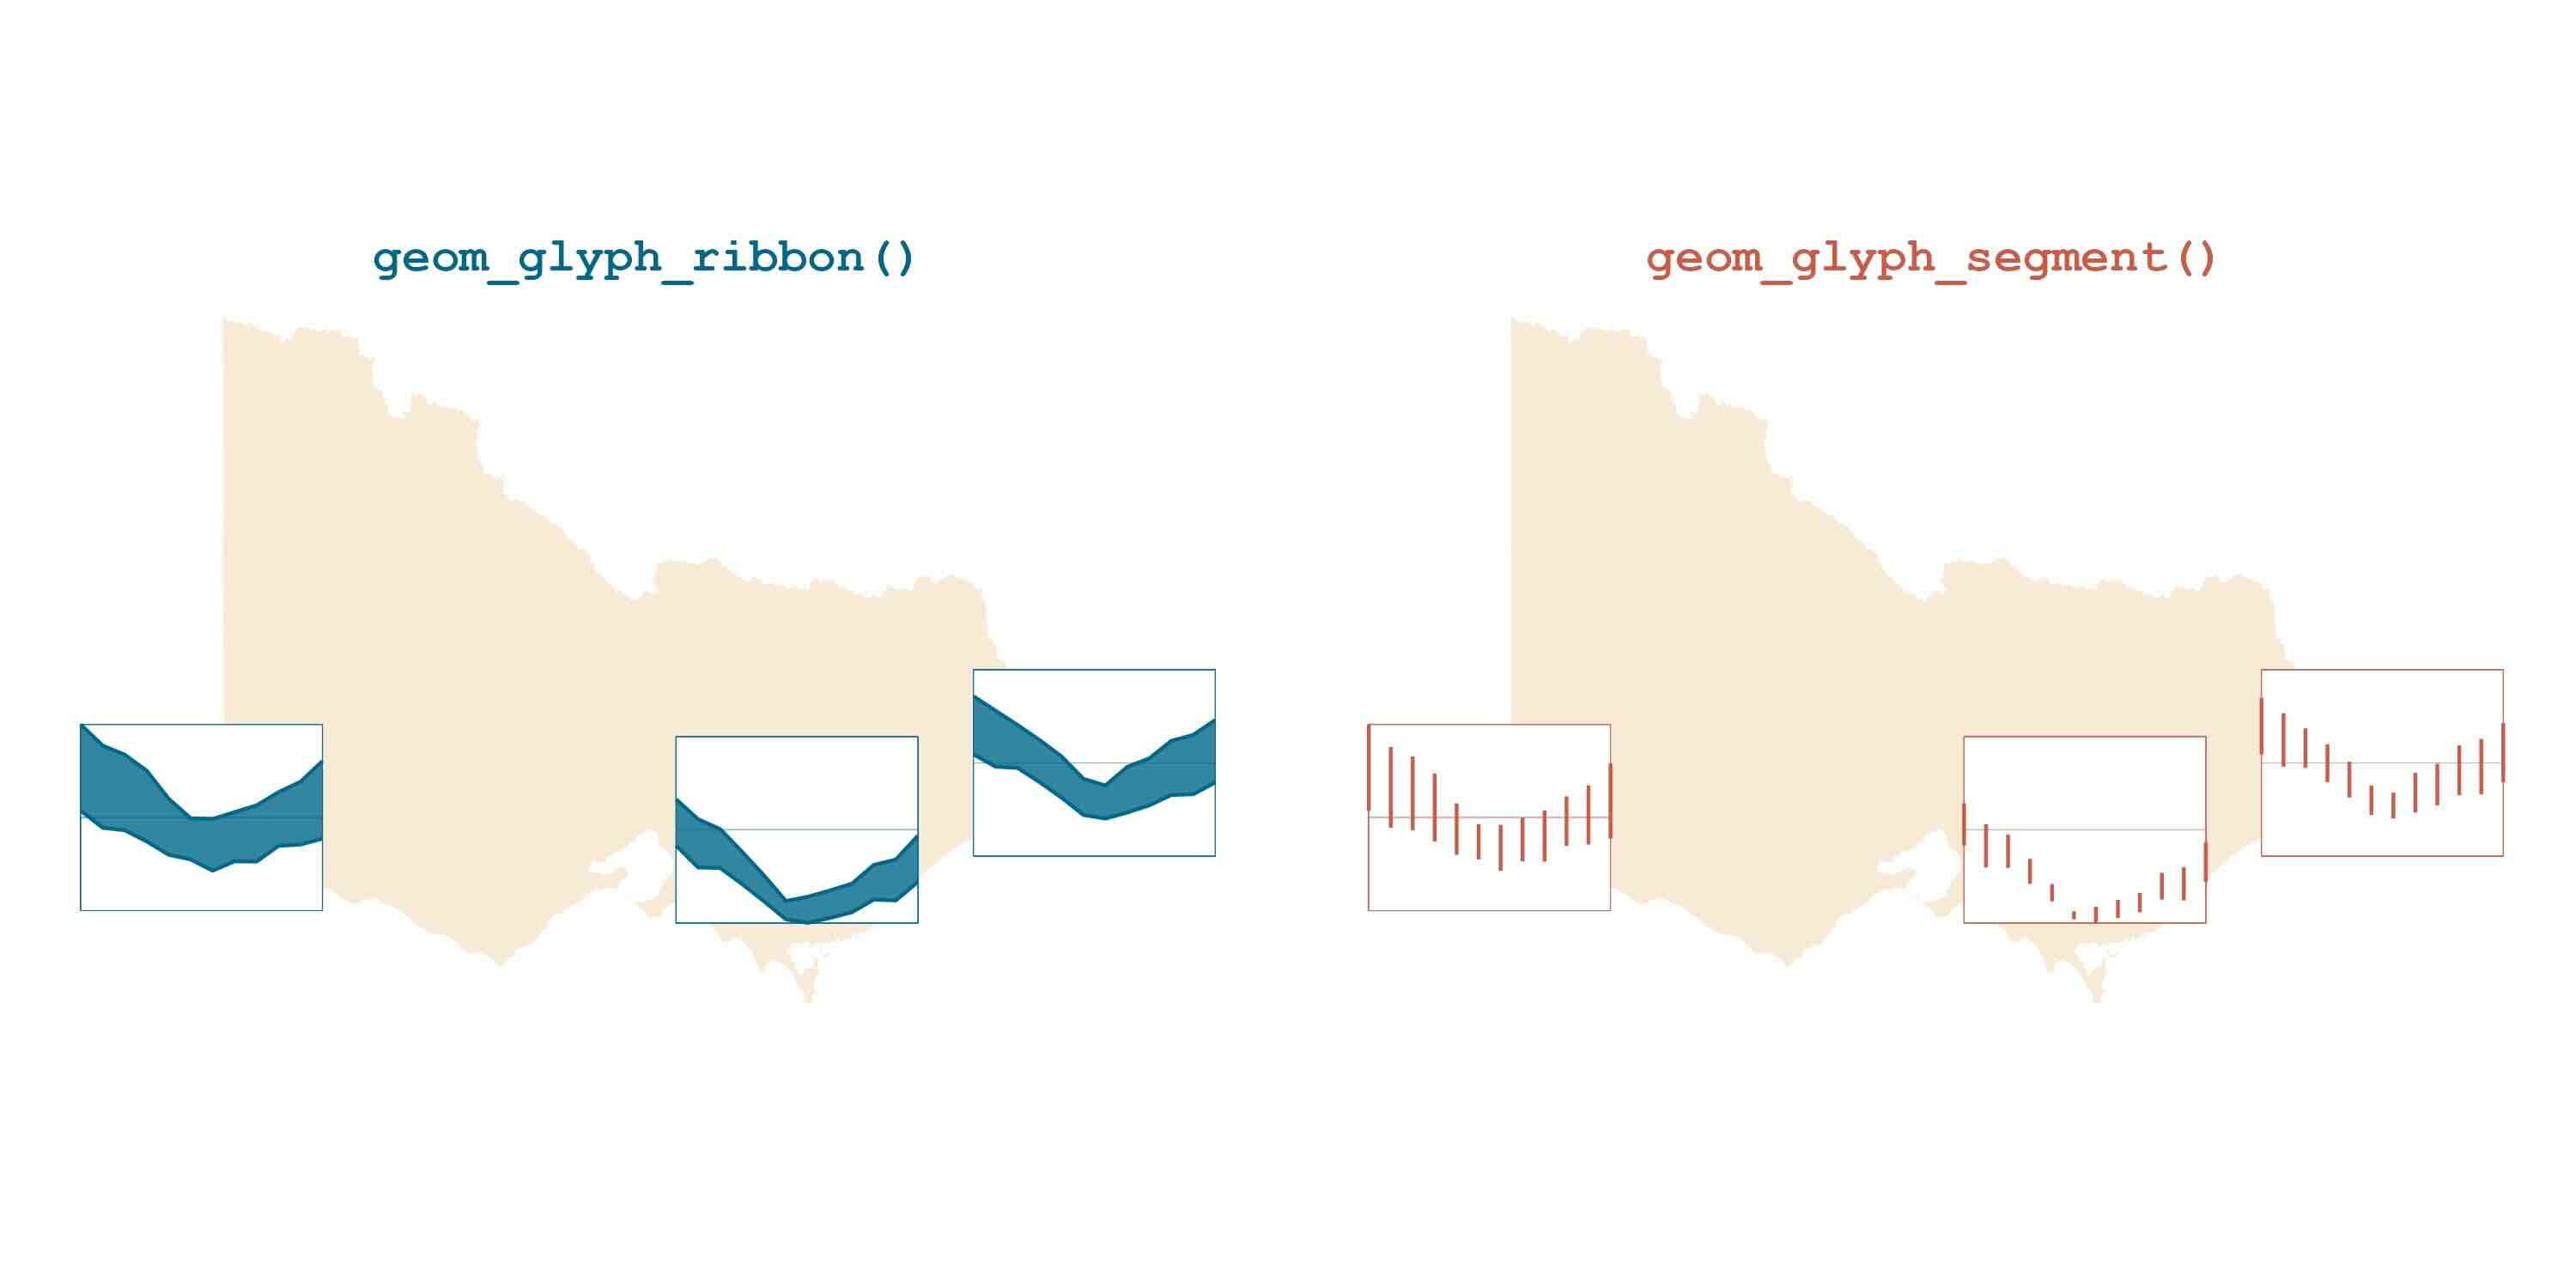
geom_glyph_ribbon() and geom_glyph_segment().
These functions create a ribbon or segment geometry designed to display
glyphs based on the combination of x_major and y_major. For each
x_minor value, geom_glyph_ribbon() displays a y interval defined by
ymin_minor and ymax_minor. Meanwhile, geom_glyph_segment() draws a
straight line between y_minor and yend_minor with respect to
x_minor.
Installation
# Download the development version from GitHub:
devtools::install_github("maliny12/sugarglider")
Usage
See the examples page to learn more about how to use sugarglider in your project.