plotor
Odds Ratio Tools for Logistic Regression
Produces odds ratio analyses with comprehensive reporting tools. Generates plots, summary tables, and diagnostic checks for logistic regression models fitted with 'glm()' using binomial family. Provides visualisation methods, formatted reporting tables via 'gt', and tools to assess logistic regression model assumptions.
README
plotor 

plotor makes it easy to generate clear, publication-ready odds-ratio plots and tables from logistic regression models.
If you work with binary outcomes, plotor helps you go from model → interpretation in seconds.
What plotor does
- Produces clean, ggplot2-based odds ratio plots
- Generates tidy odds ratio tables (with optional mini-plots)
- Provides automated assumption checks for logistic regression
- Works seamlessly with the tidyverse
Example outputs
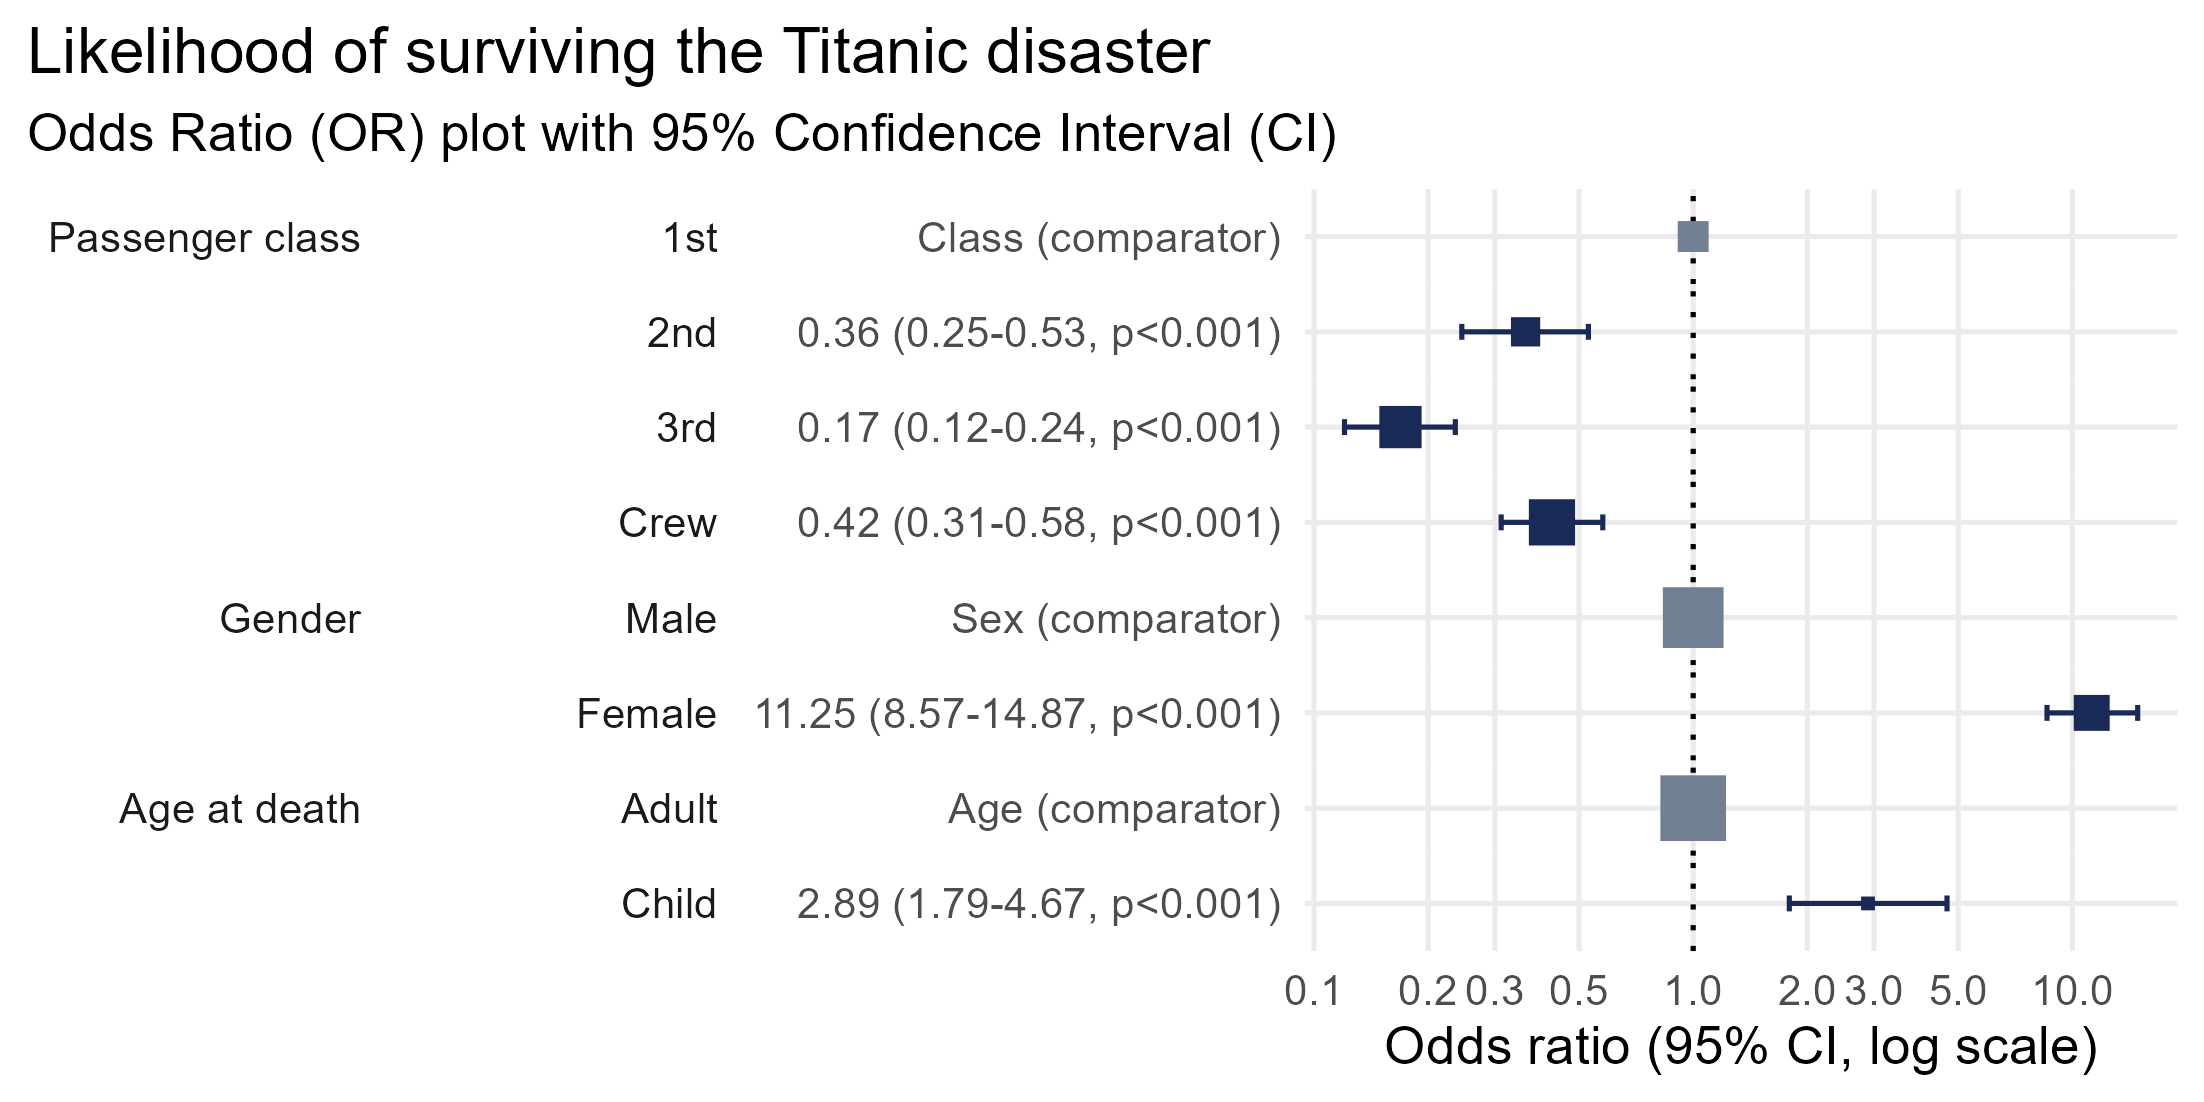
Odds ratio plot
A single function call gives you a polished OR plot:
Odds ratio table with mini-plot
Perfect for reports and publications:
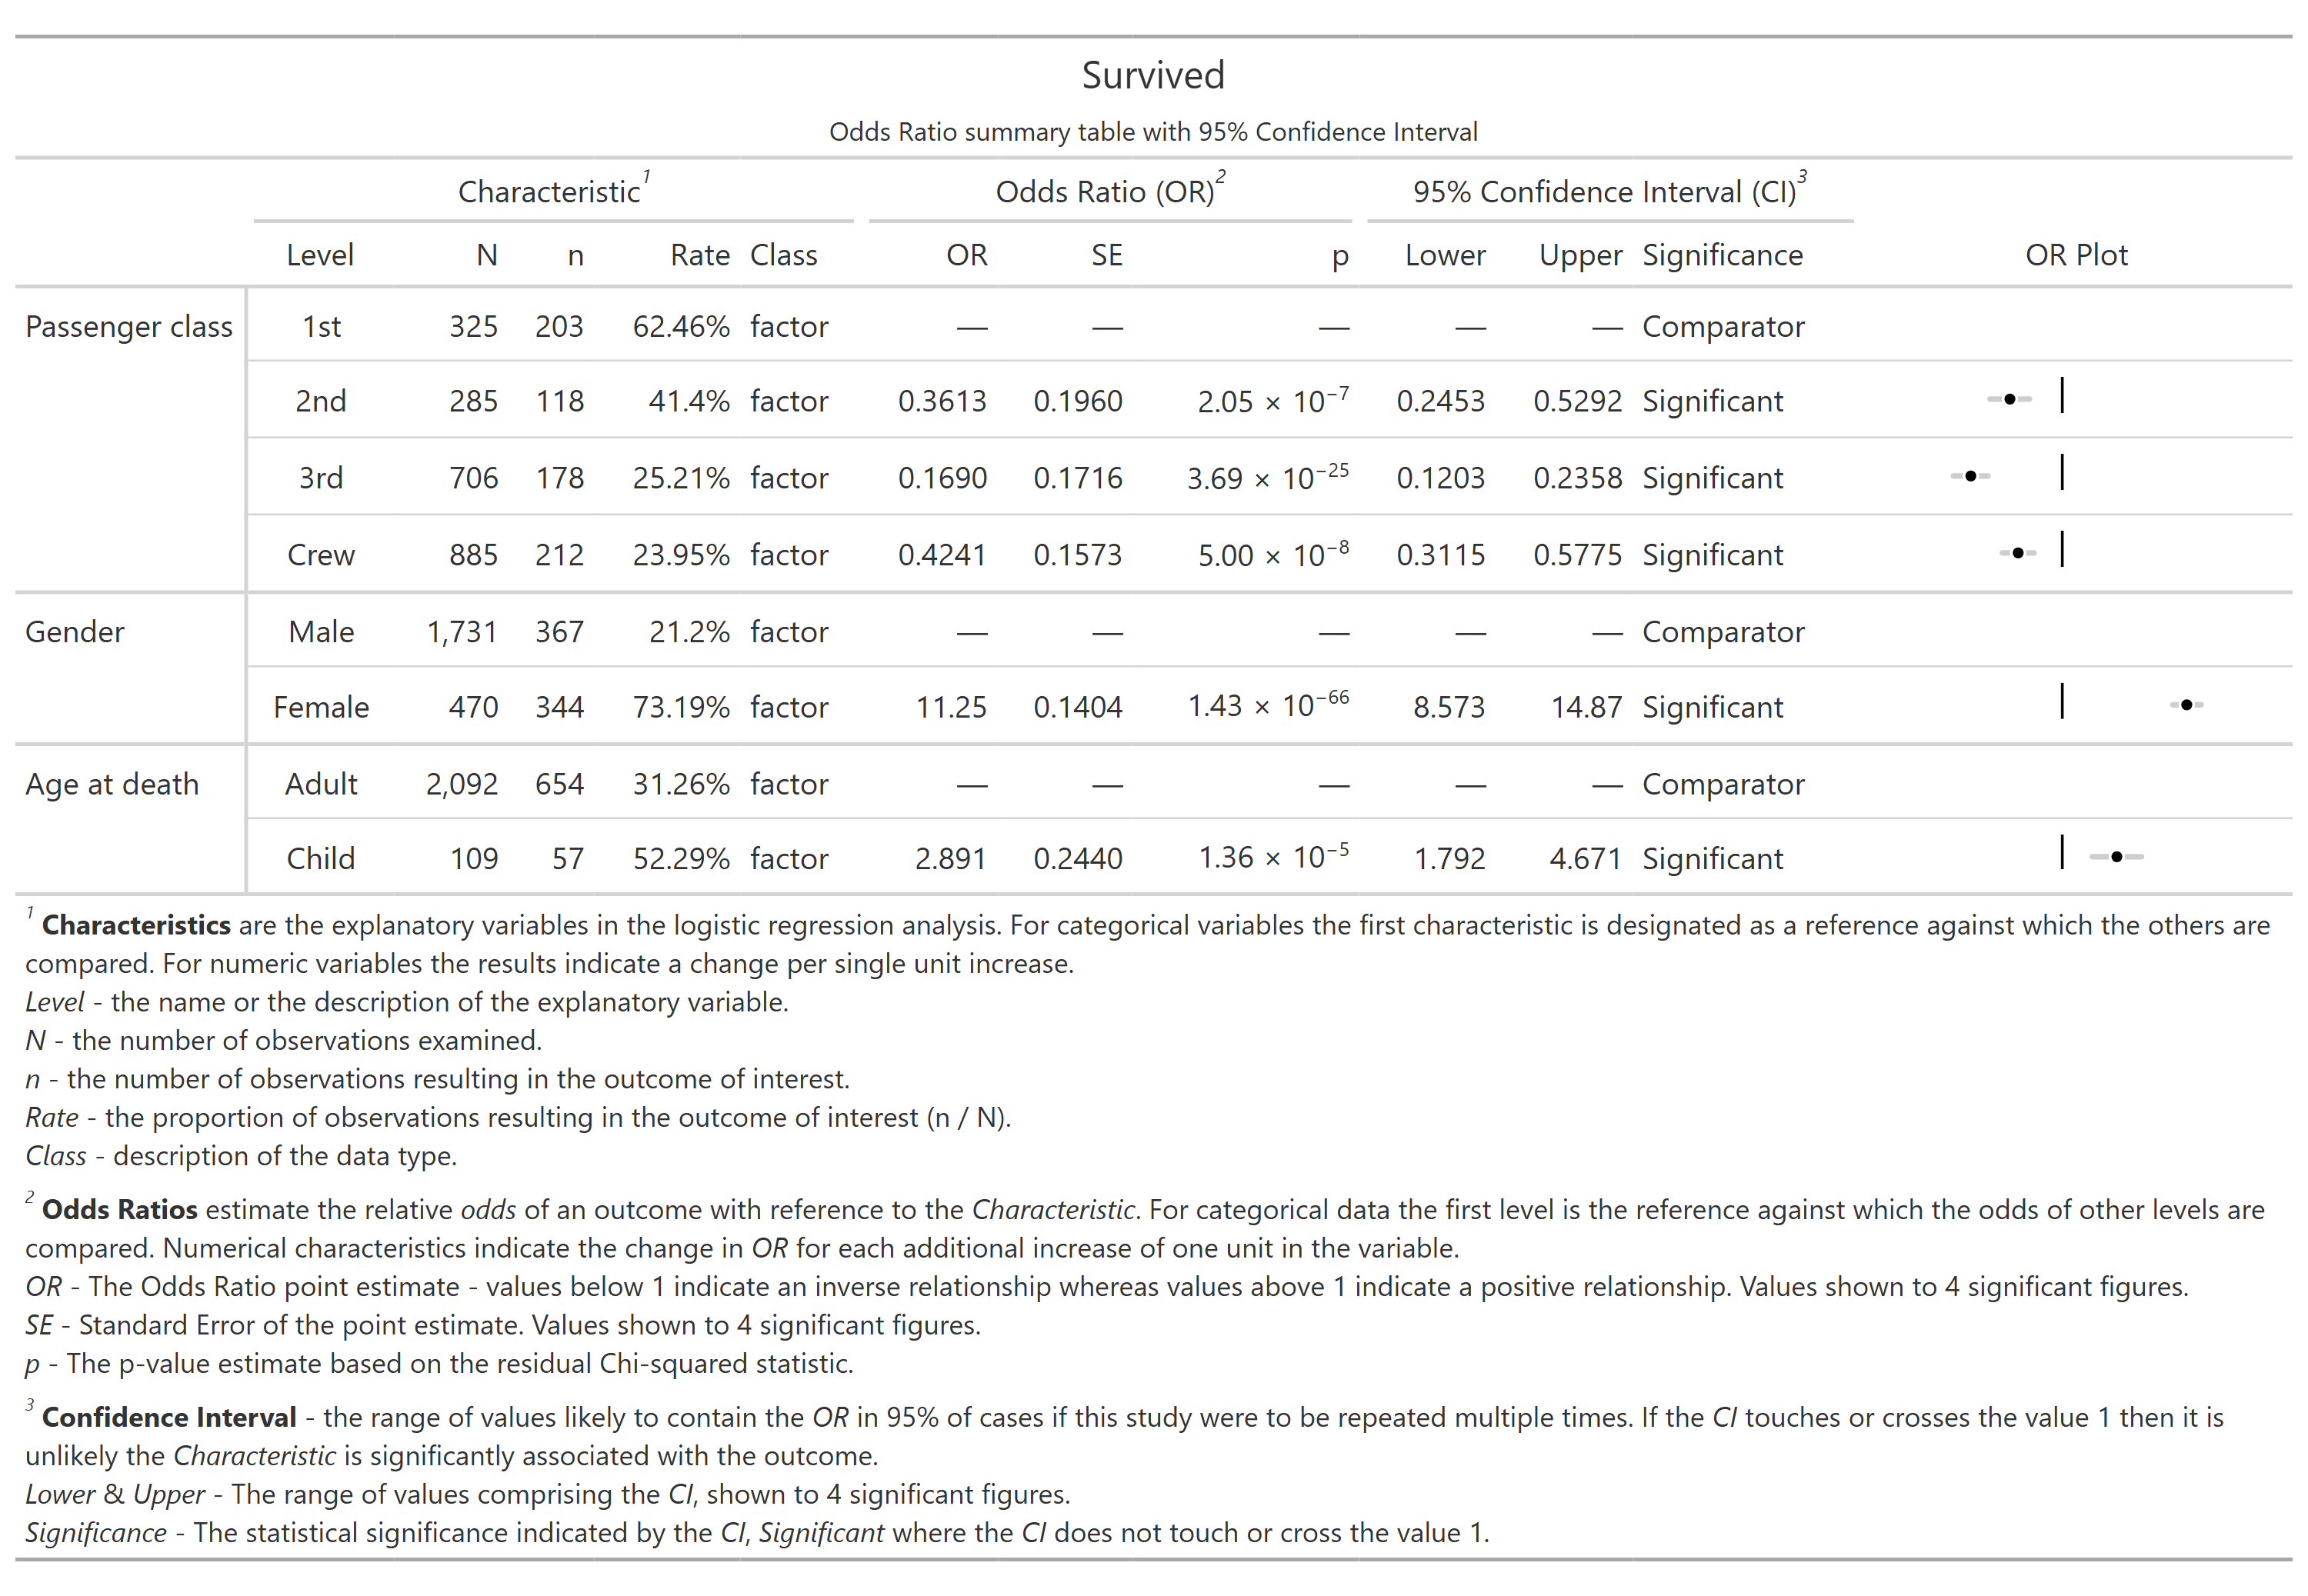
See full table output options →
Automated assumption checks
plotor includes built-in checks to help validate your logistic regression model:
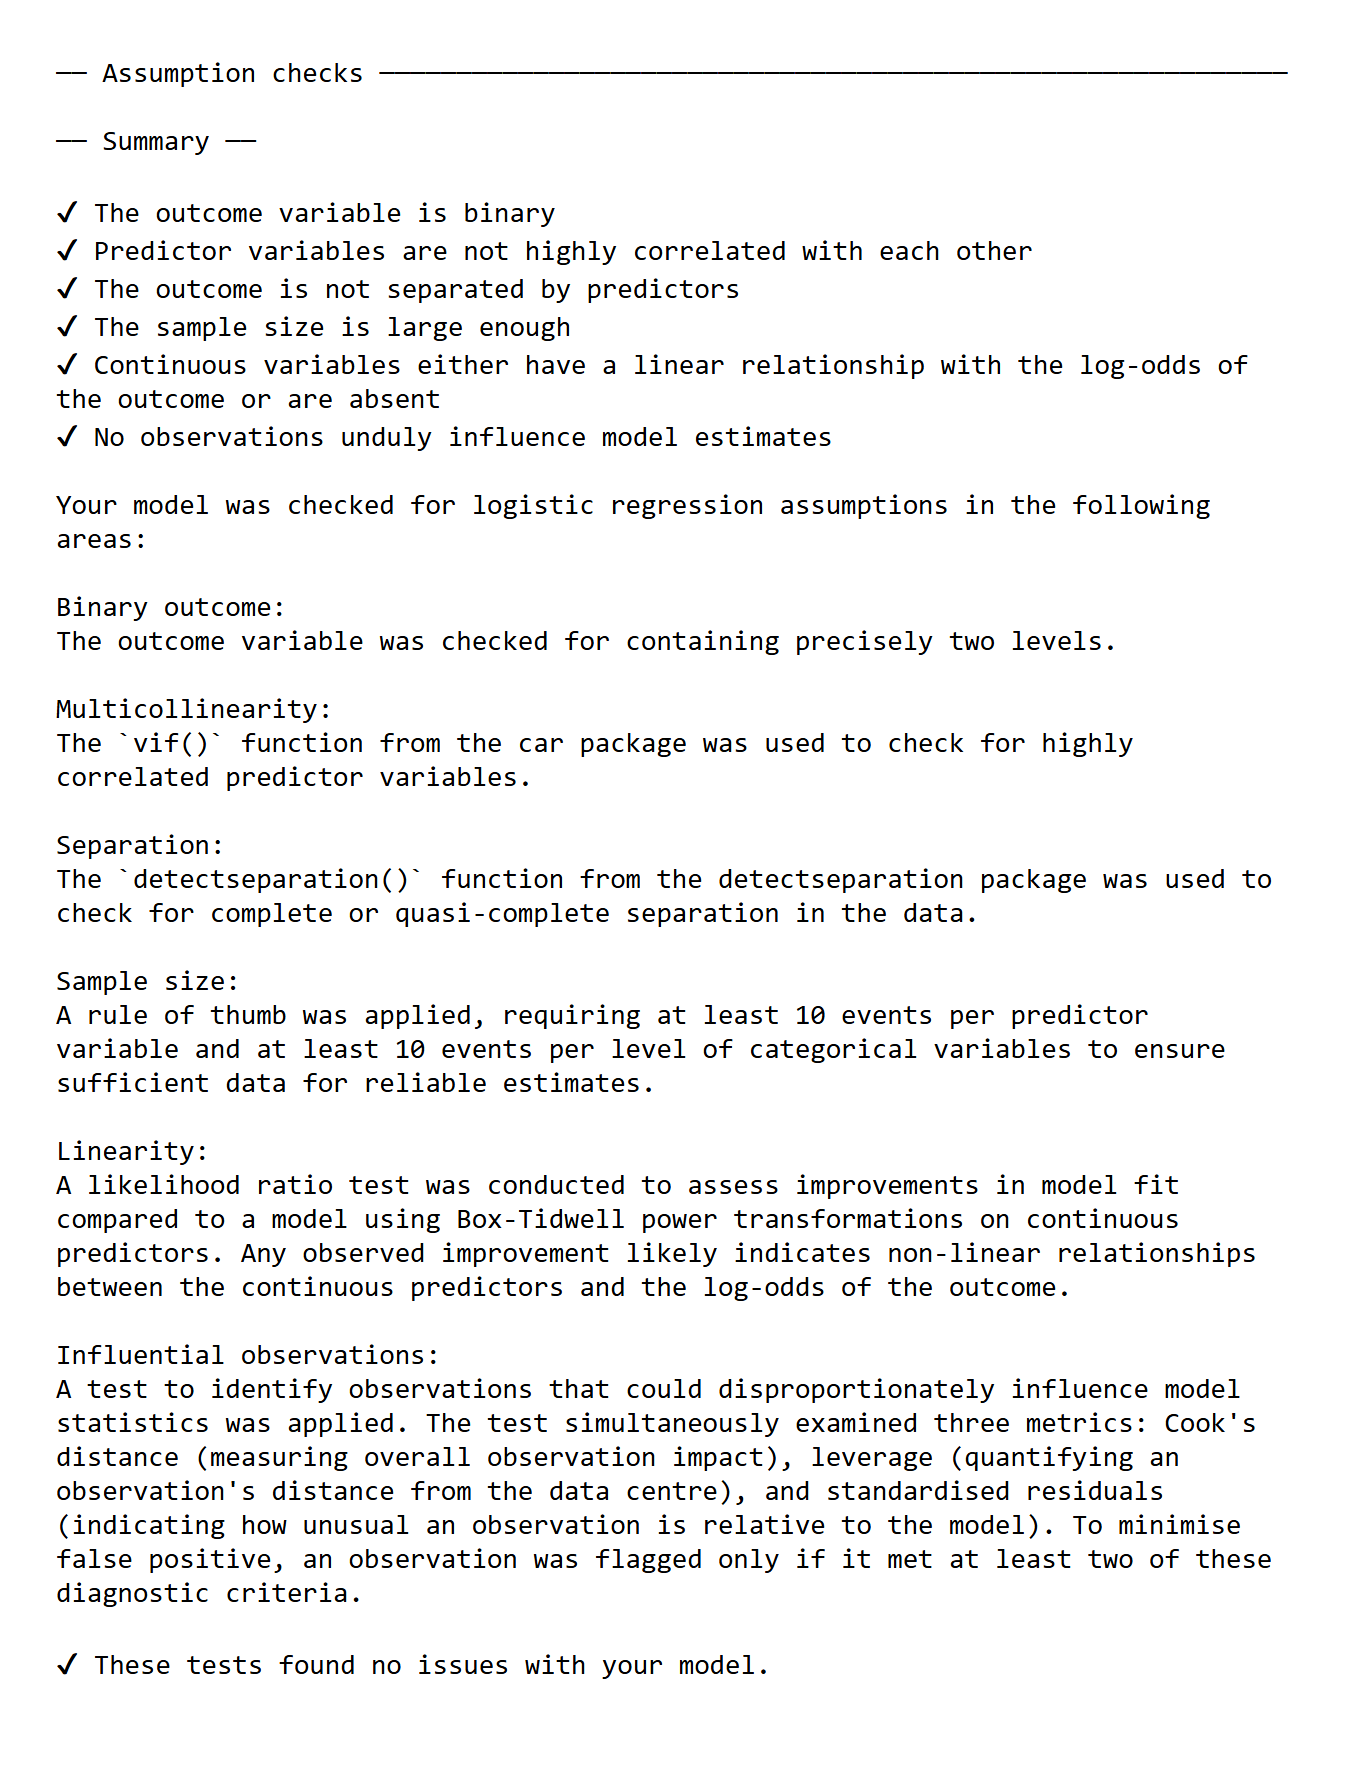
See full assumption check output →
Installation
Stable release (CRAN):
install.packages("plotor")
Using {pak}:
# install.packages("pak")
pak::pak("plotor")
Development version:
# install.packages("pak")
pak::pak("craig-parylo/plotor")
Minimal example
library(plotor)

# load the titanic dataset from the package
df_titanic <- get_df_titanic()

# make a logistic regression model using this data
model <- stats::glm(
  data = df_titanic,
  formula = Survived ~ Class + Sex + Age,
  family = "binomial"
)

# plot the odds ratios
plot_or(model)
Learn more
- Plotting odds ratios:
?plot_or - Tabulating odds ratios:
?table_or - Assumption checks:
?check_or
Full documentation: https://craig-parylo.github.io/plotor/