ellipse
Functions for Drawing Ellipses and Ellipse-Like Confidence Regions
Contains various routines for drawing
ellipses and ellipse-like confidence regions, implementing the plots
described in Murdoch and Chow (1996,
ellipse

ellipse contains ellipse drawing routines designed for pairwise
confidence regions, including distorted ellipses for nonlinear
regression regions. It also includes a routine plotcorr() for plotting
correlation matrices using ellipses.
Installation
It is on CRAN, and can be installed using
install.packages("ellipse")
You can install the development version of ellipse from GitHub with:
# install.packages("devtools")
devtools::install_github("dmurdoch/ellipse")
Example
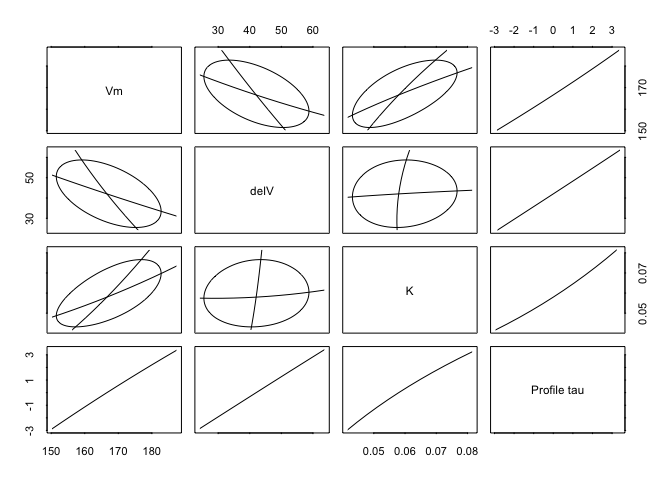
Plot approximate pairwise confidence regions and profile trace plots for a nonlinear fit:
data(Puromycin)
Purboth <- nls(formula = rate ~ ((Vm + delV * (state == "treated"))
   * conc)/(K + conc), data = Puromycin,
   start = list(Vm = 160, delV = 40, K = 0.05))
Pur.prof <- profile(Purboth)
ellipse::pairs(Pur.prof)
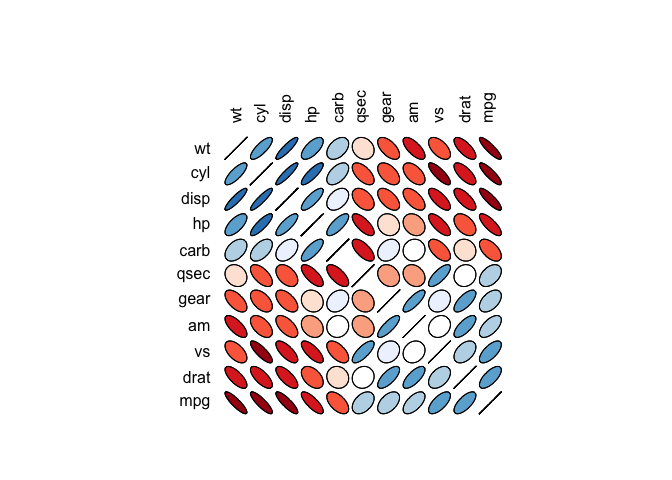
The plotcorr() function can plot a matrix of ellipses:
library(ellipse)
#>
#> Attaching package: 'ellipse'
#> The following object is masked from 'package:graphics':
#>
#>     pairs
corr.mtcars <- cor(mtcars)
ord <- order(corr.mtcars[1,])
xc <- corr.mtcars[ord, ord]
colors <- c("#A50F15","#DE2D26","#FB6A4A","#FCAE91","#FEE5D9","white",
            "#EFF3FF","#BDD7E7","#6BAED6","#3182BD","#08519C")
plotcorr(xc, col=colors[5*xc + 6])