easysurv
Simplify Survival Data Analysis and Model Fitting
Inspect survival data, plot Kaplan-Meier curves, assess the proportional hazards assumption, fit parametric survival models, predict and plot survival and hazards, and export the outputs to 'Excel'. A simple interface for fitting survival models using flexsurv::flexsurvreg(), flexsurv::flexsurvspline(), flexsurvcure::flexsurvcure(), and survival::survreg().
easysurv 


The easysurv R package provides tools to simplify survival data
analysis and model fitting.
This includes tools to inspect survival data, plot Kaplan-Meier curves, assess the proportional hazards assumption, fit parametric survival models, predict and plot survival and hazards, and export the outputs to Excel.
For fitting survival models, the package provides a simple interface to
flexsurv::flexsurvreg(), flexsurv::flexsurvspline(),
flexsurvcure::flexsurvcure(), and survival::survreg().
By default, the package uses the flexsurv engine
(flexsurv::flexsurvreg()) and provides a helpful starting point to
explore survival extrapolations across frequently used distributions
(such as exponential, generalized gamma, gamma, Gompertz, log-logistic,
log-normal and Weibull).
Installation
If you haven’t already, install R and consider using an integrated development environment (IDE) such as RStudio or Positron.
# You will need to have the pak package installed.
install.packages("pak")

# Then, install easysurv either from GitHub for the latest version:
pak::pkg_install("Maple-Health-Group/easysurv")

# Or from CRAN for the latest stable version:
pak::pkg_install("easysurv")
Getting started
# Attach the easysurv library
library(easysurv)

# Open an example script
quick_start()
## Note: The default file name is "easysurv_start.R", but you can define your own, e.g.
## quick_start("my_file_name.R")

# Access help files
help(package = "easysurv")
Examples
Start by tidying your data…
# Load the easy_lung data from the easysurv package
# Recode the "status" variable to create an event indicator (0/1)
surv_data <- easy_lung |>
  dplyr::mutate(
    time = time,
    event = status - 1,
    group = sex,
    .after = time
  ) |>
  dplyr::select(-c(inst, ph.karno, pat.karno)) # remove some unused columns

# Make the group variable a factor and assign level labels.
surv_data <- surv_data |>
  dplyr::mutate_at("group", as.factor)
levels(surv_data$group) <- c("Male", "Female")
… then enjoy the easysurv functions!
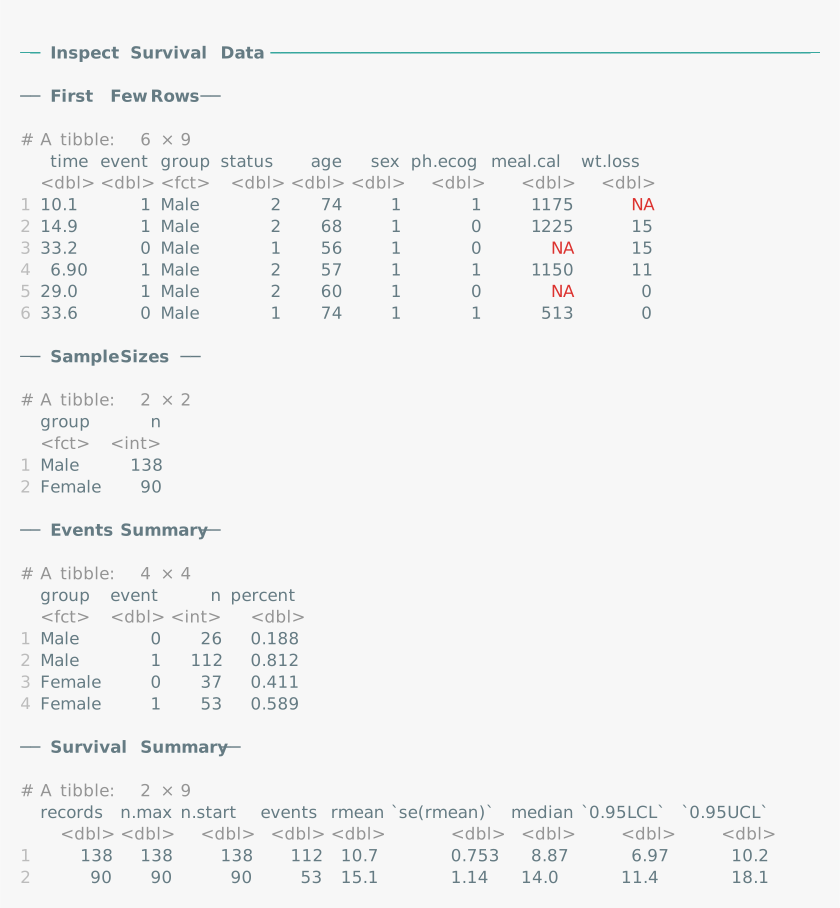
inspect_surv_data()
inspect_surv_data(
  data = surv_data,
  time = "time",
  event = "event",
  group = "group"
)
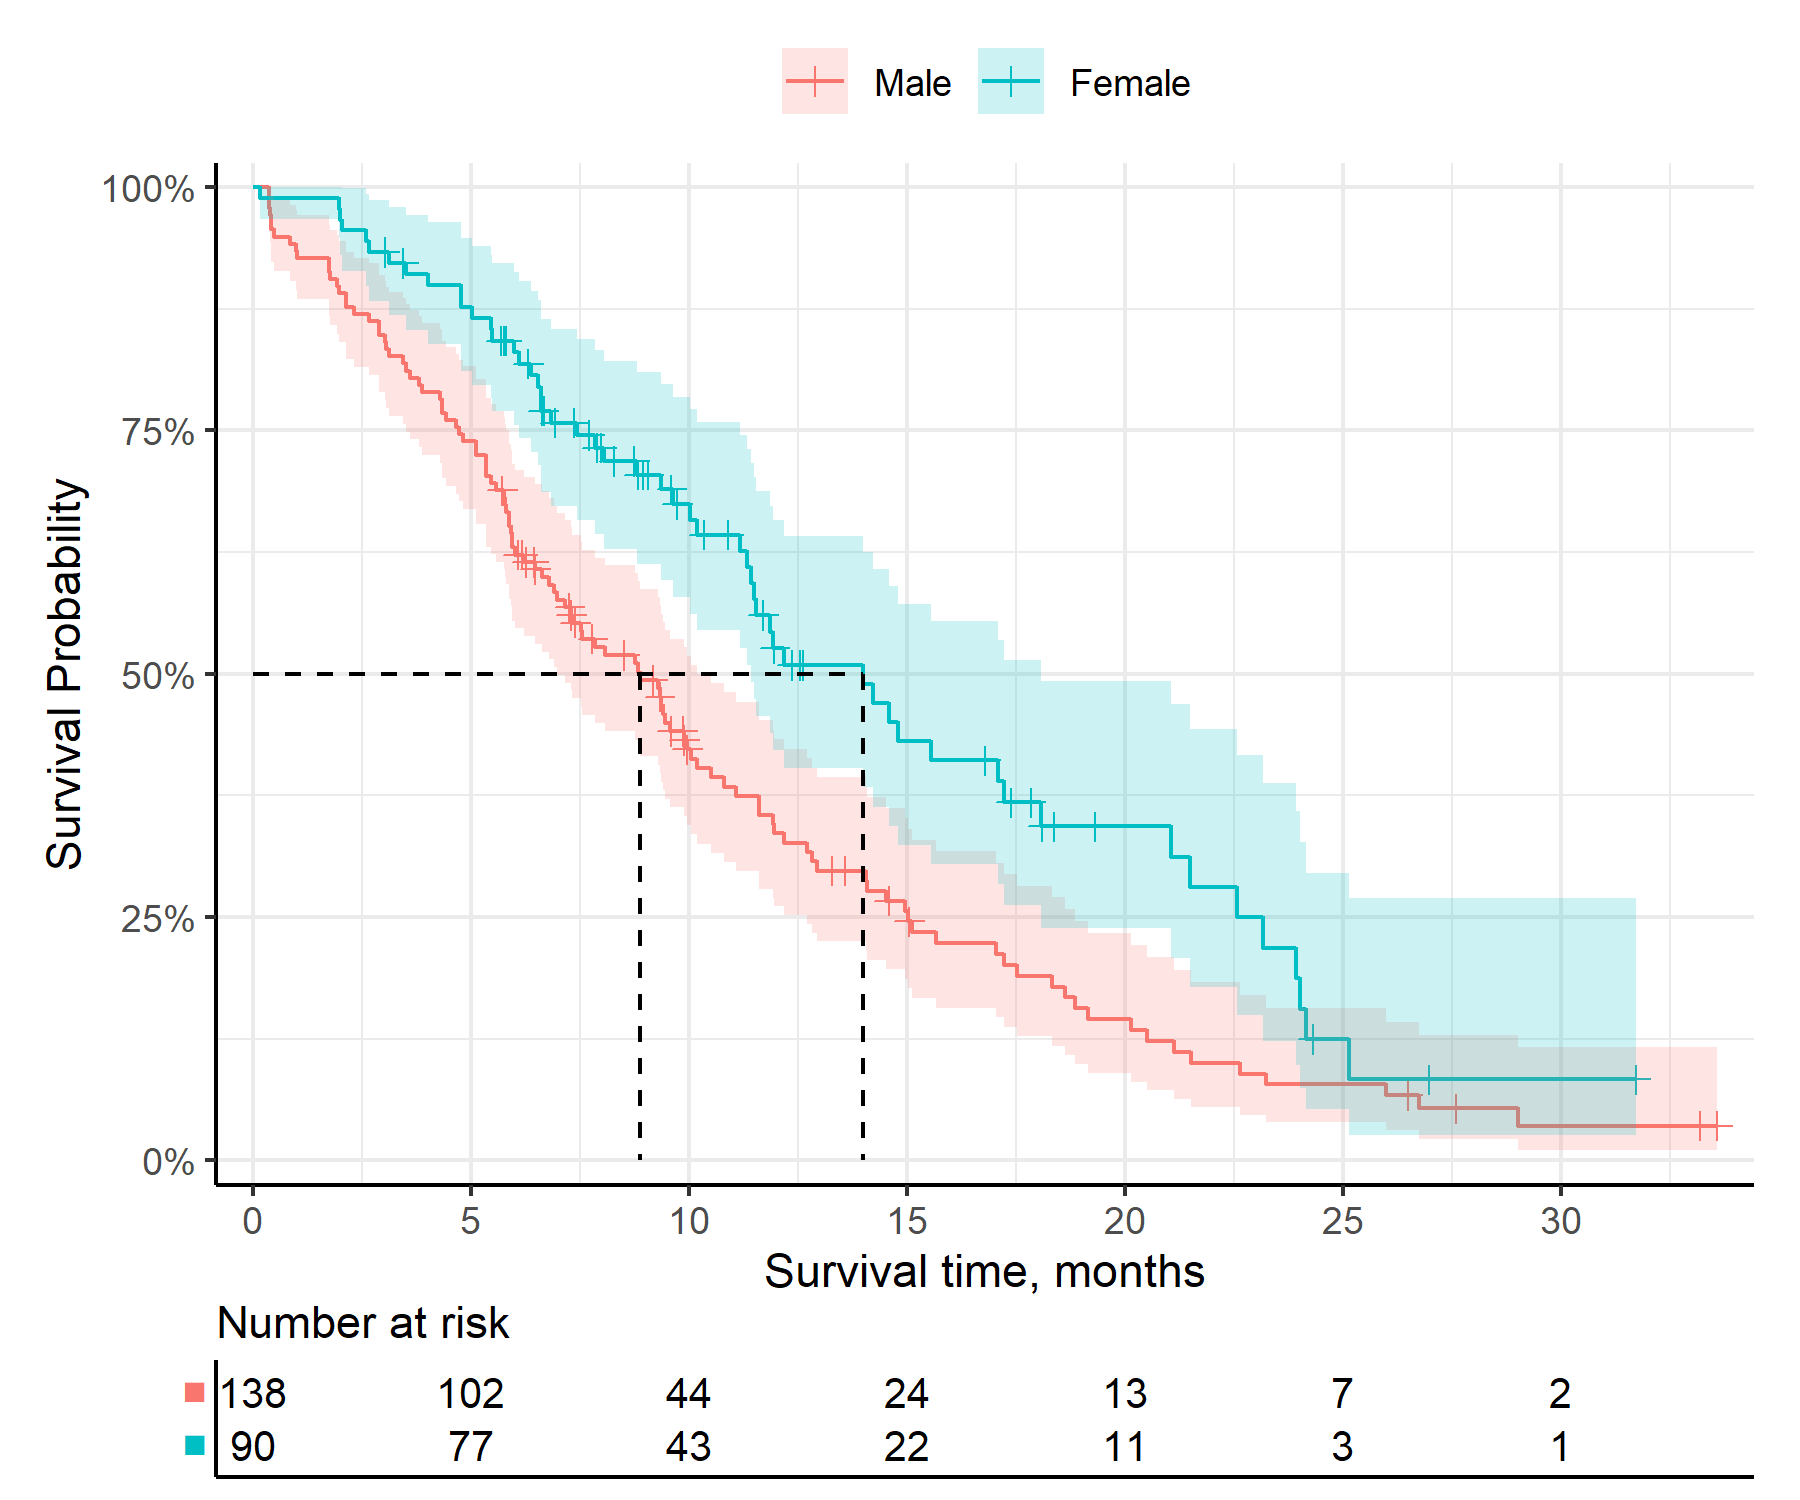
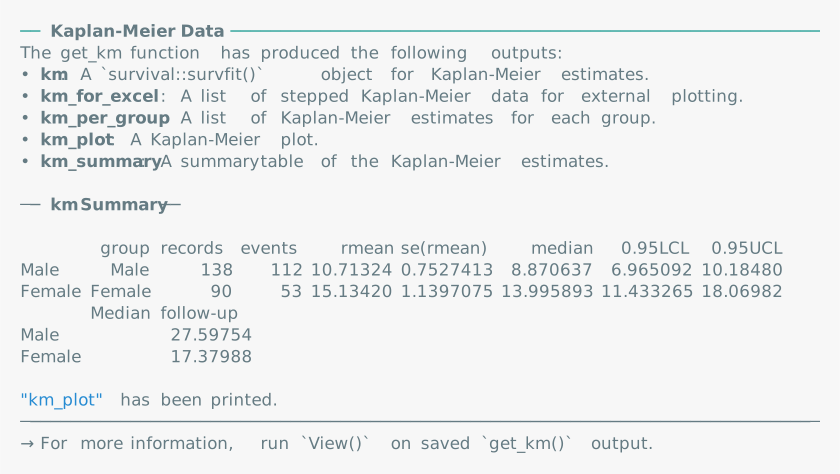
get_km()
km_check <- get_km(
  data = surv_data,
  time = "time",
  event = "event",
  group = "group"
)

print(km_check)
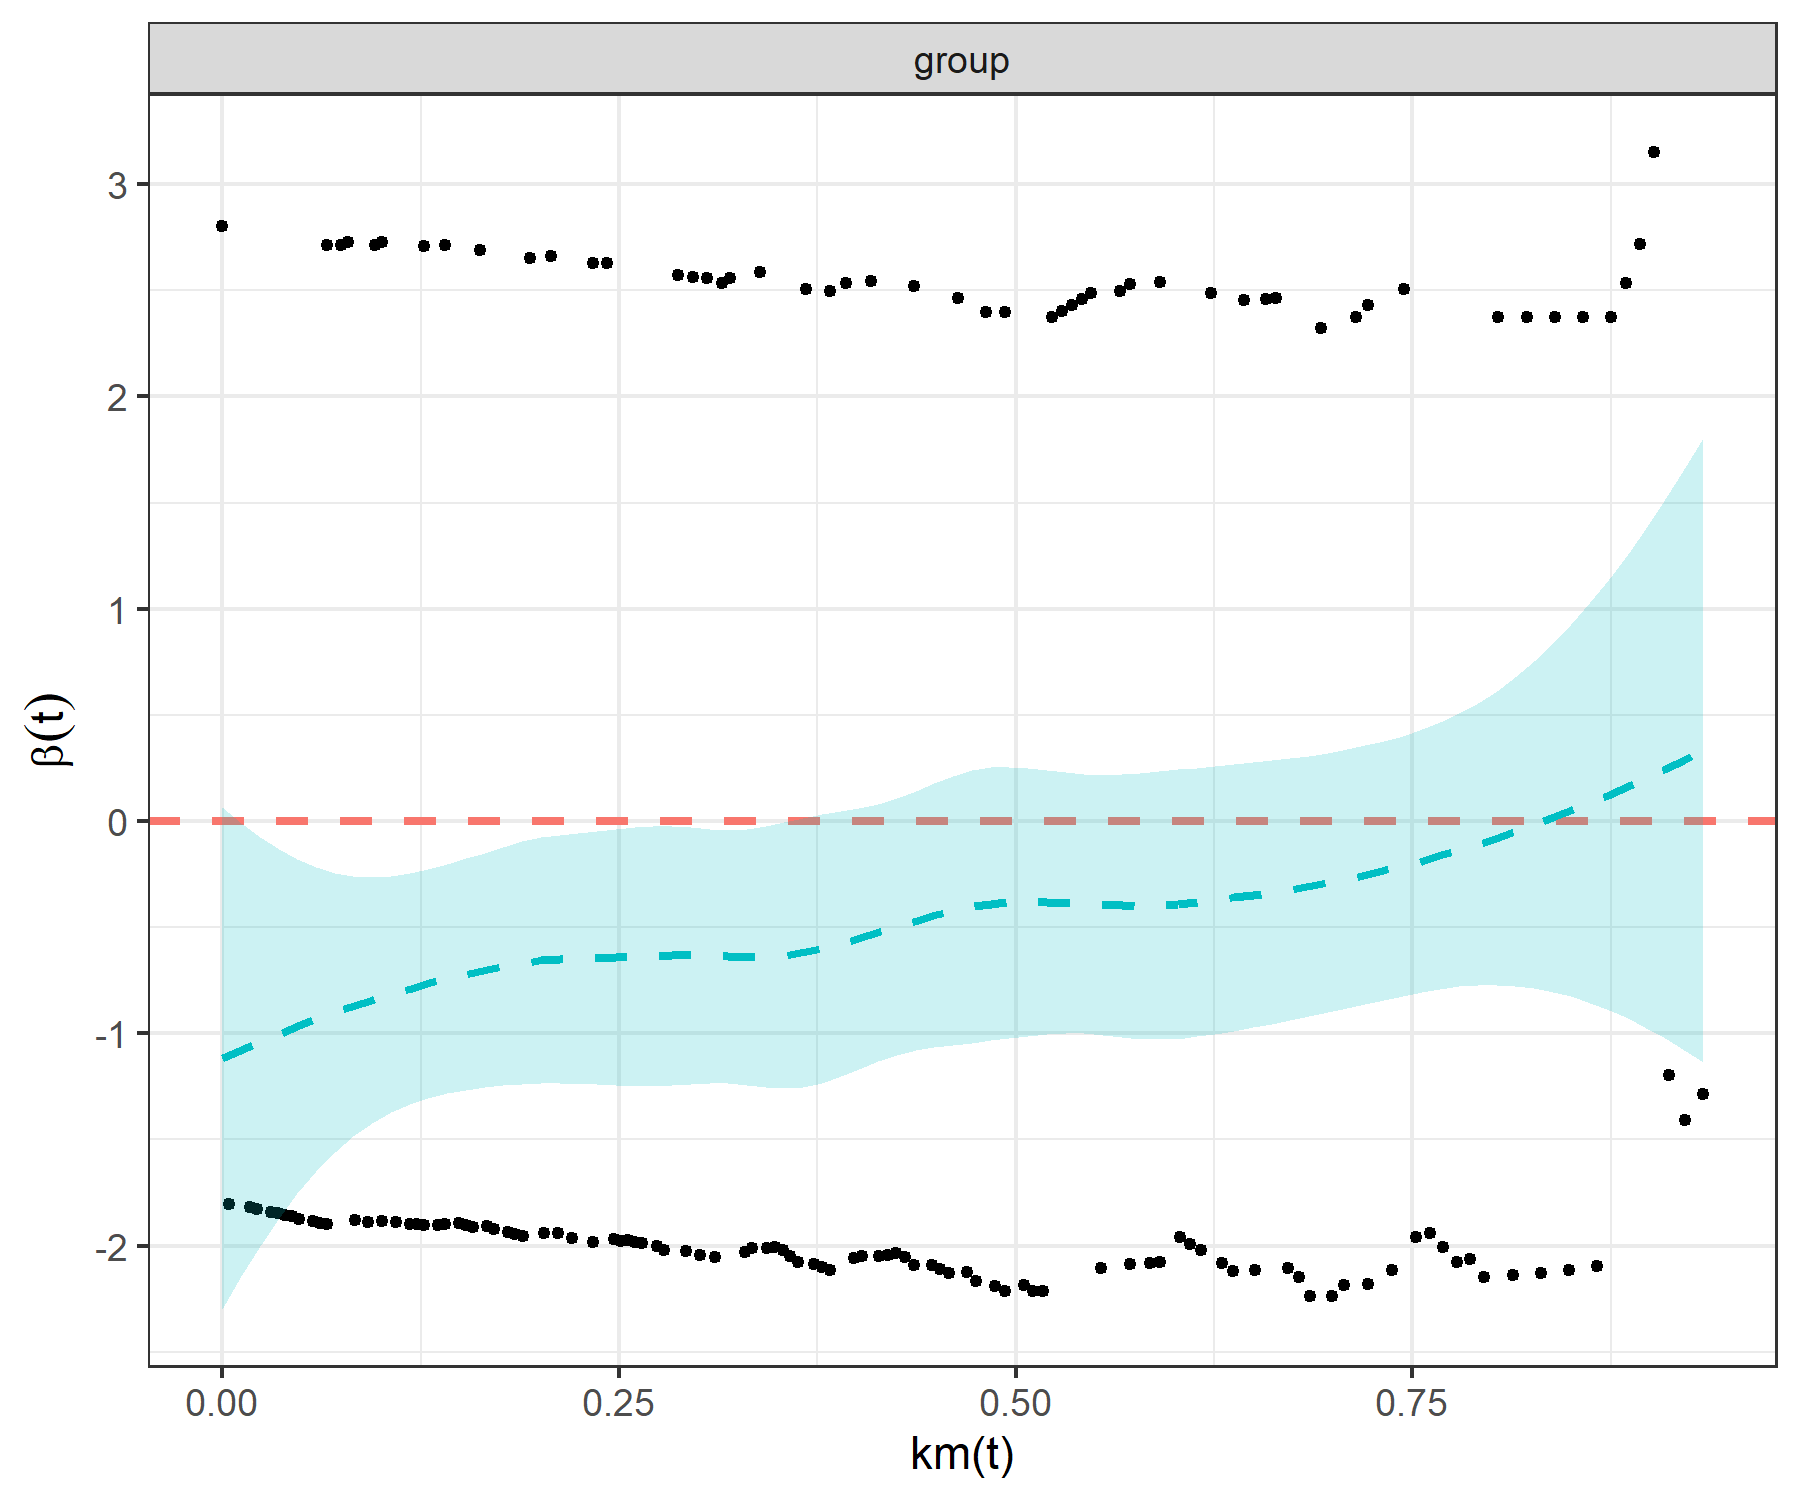
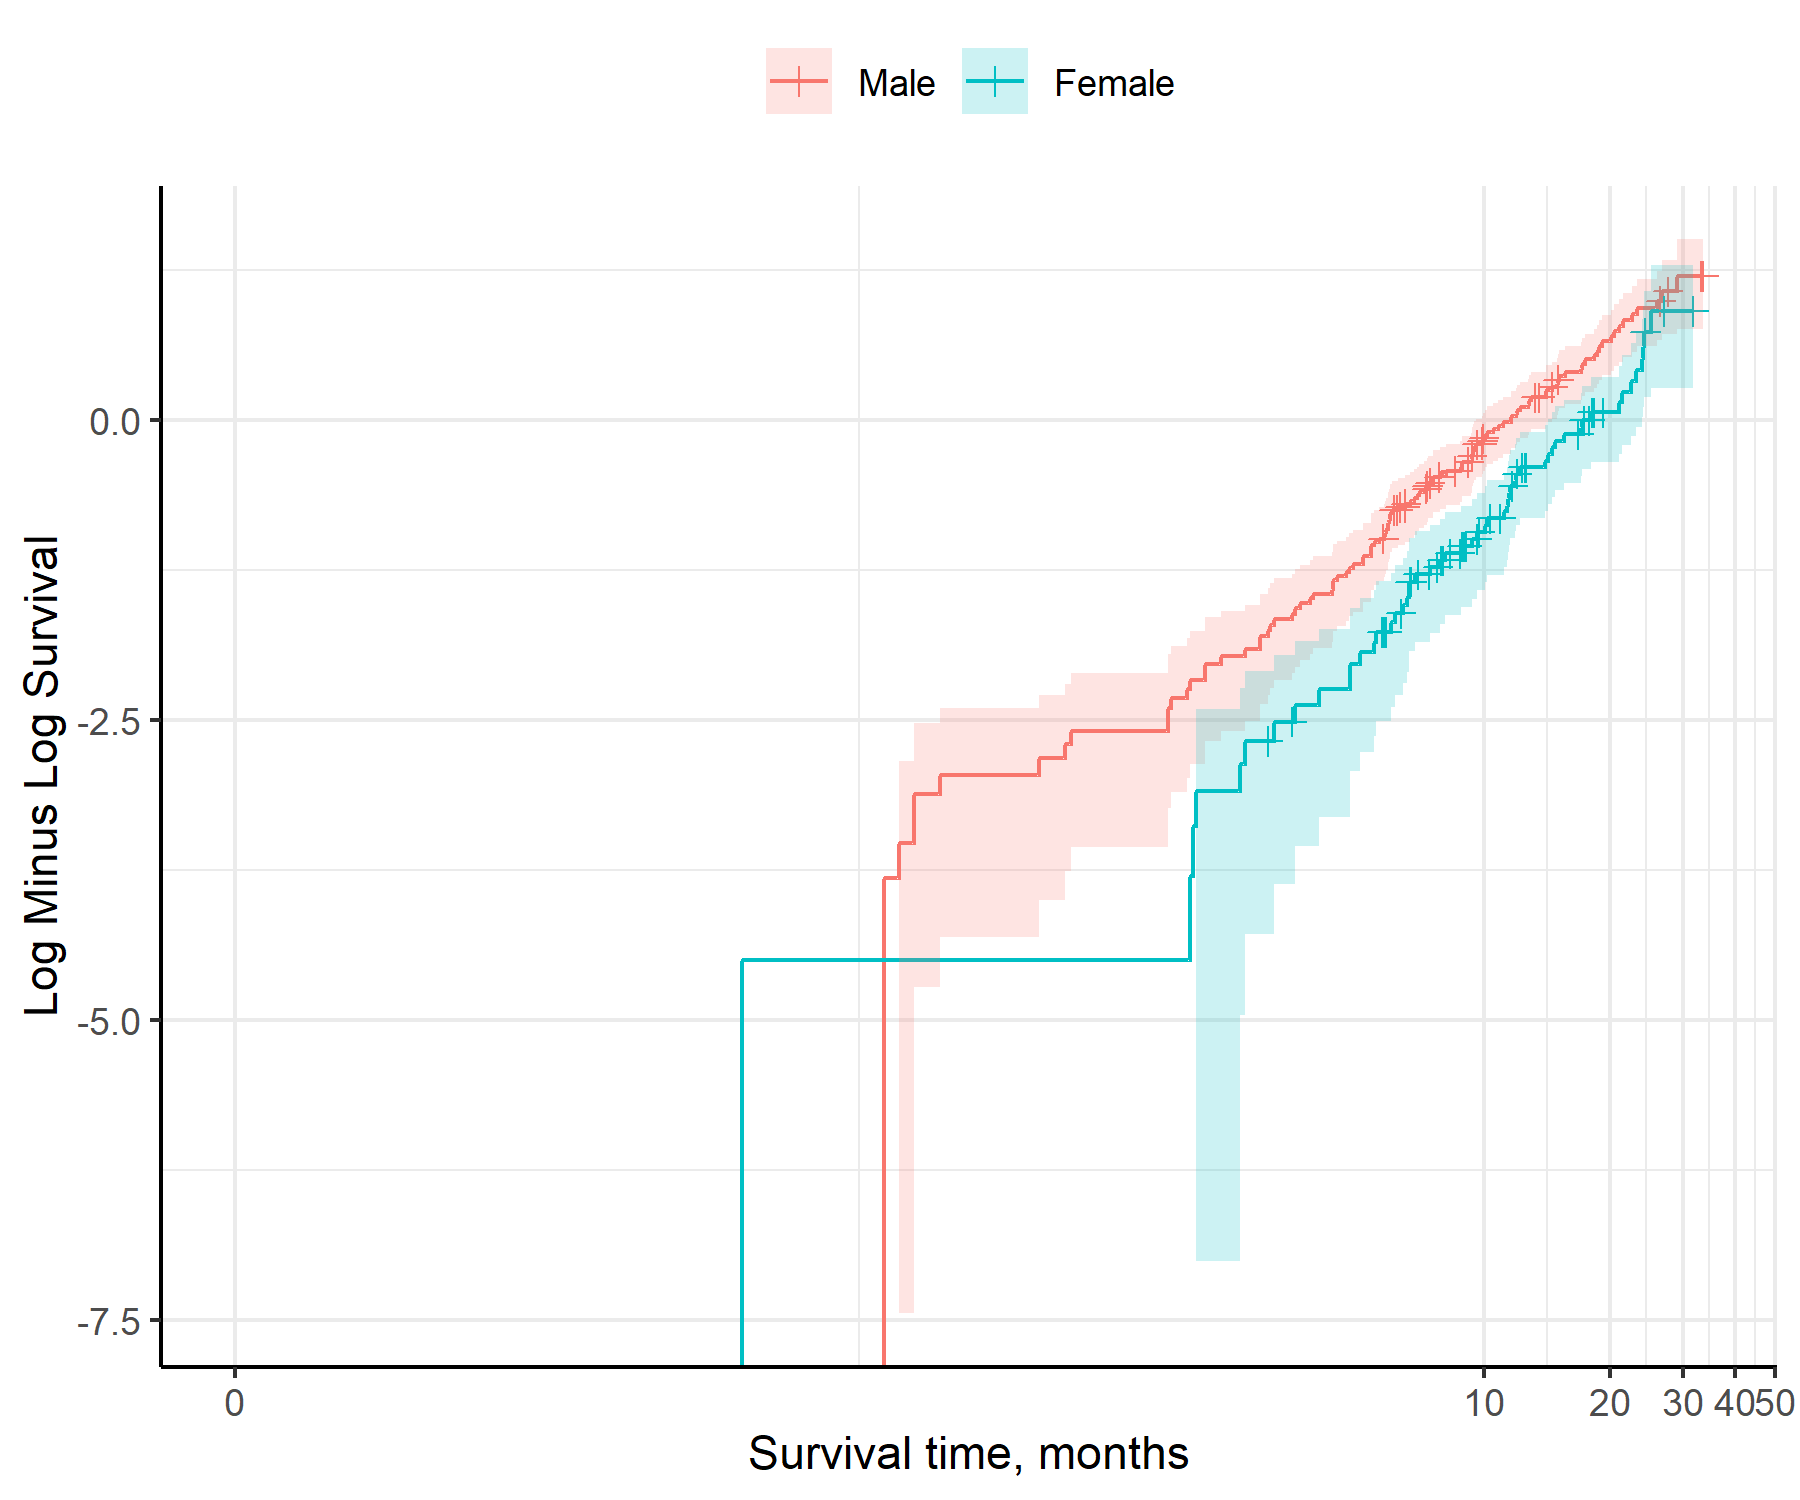
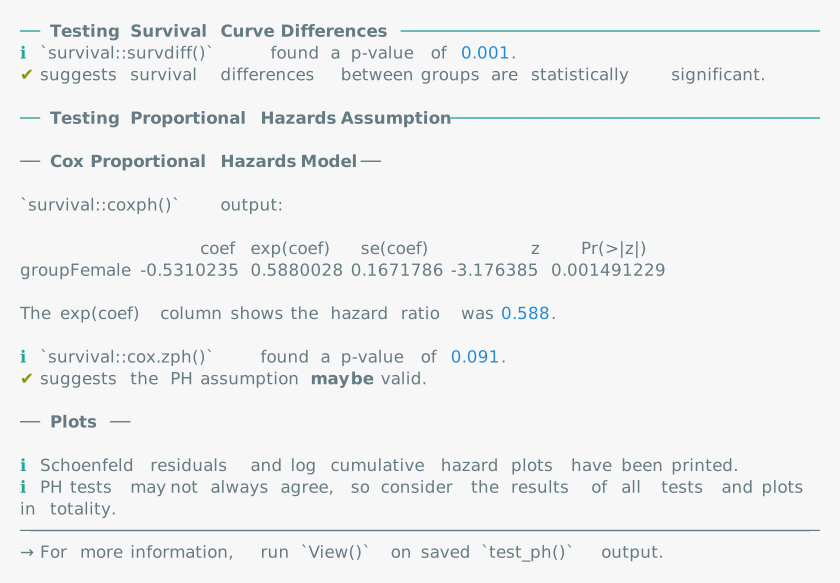
test_ph()
ph_check <- test_ph(
  data = surv_data,
  time = "time",
  event = "event",
  group = "group"
)

print(ph_check)
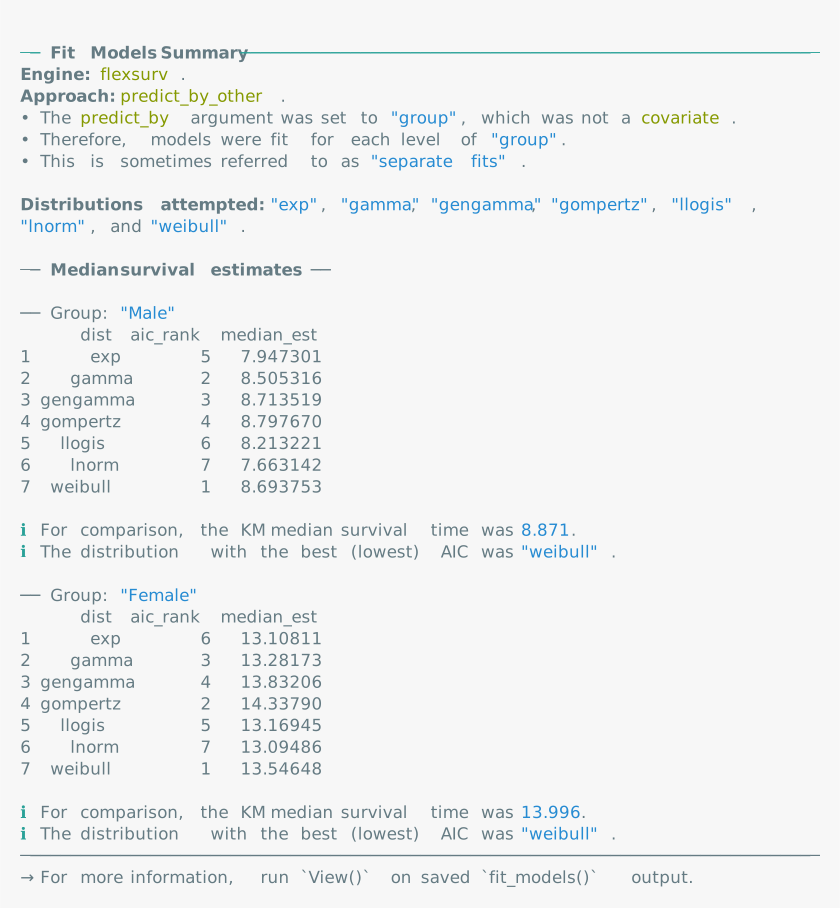
fit_models()
separate_models <- fit_models(
  data = surv_data,
  time = "time",
  event = "event",
  predict_by = "group"
)

print(separate_models)
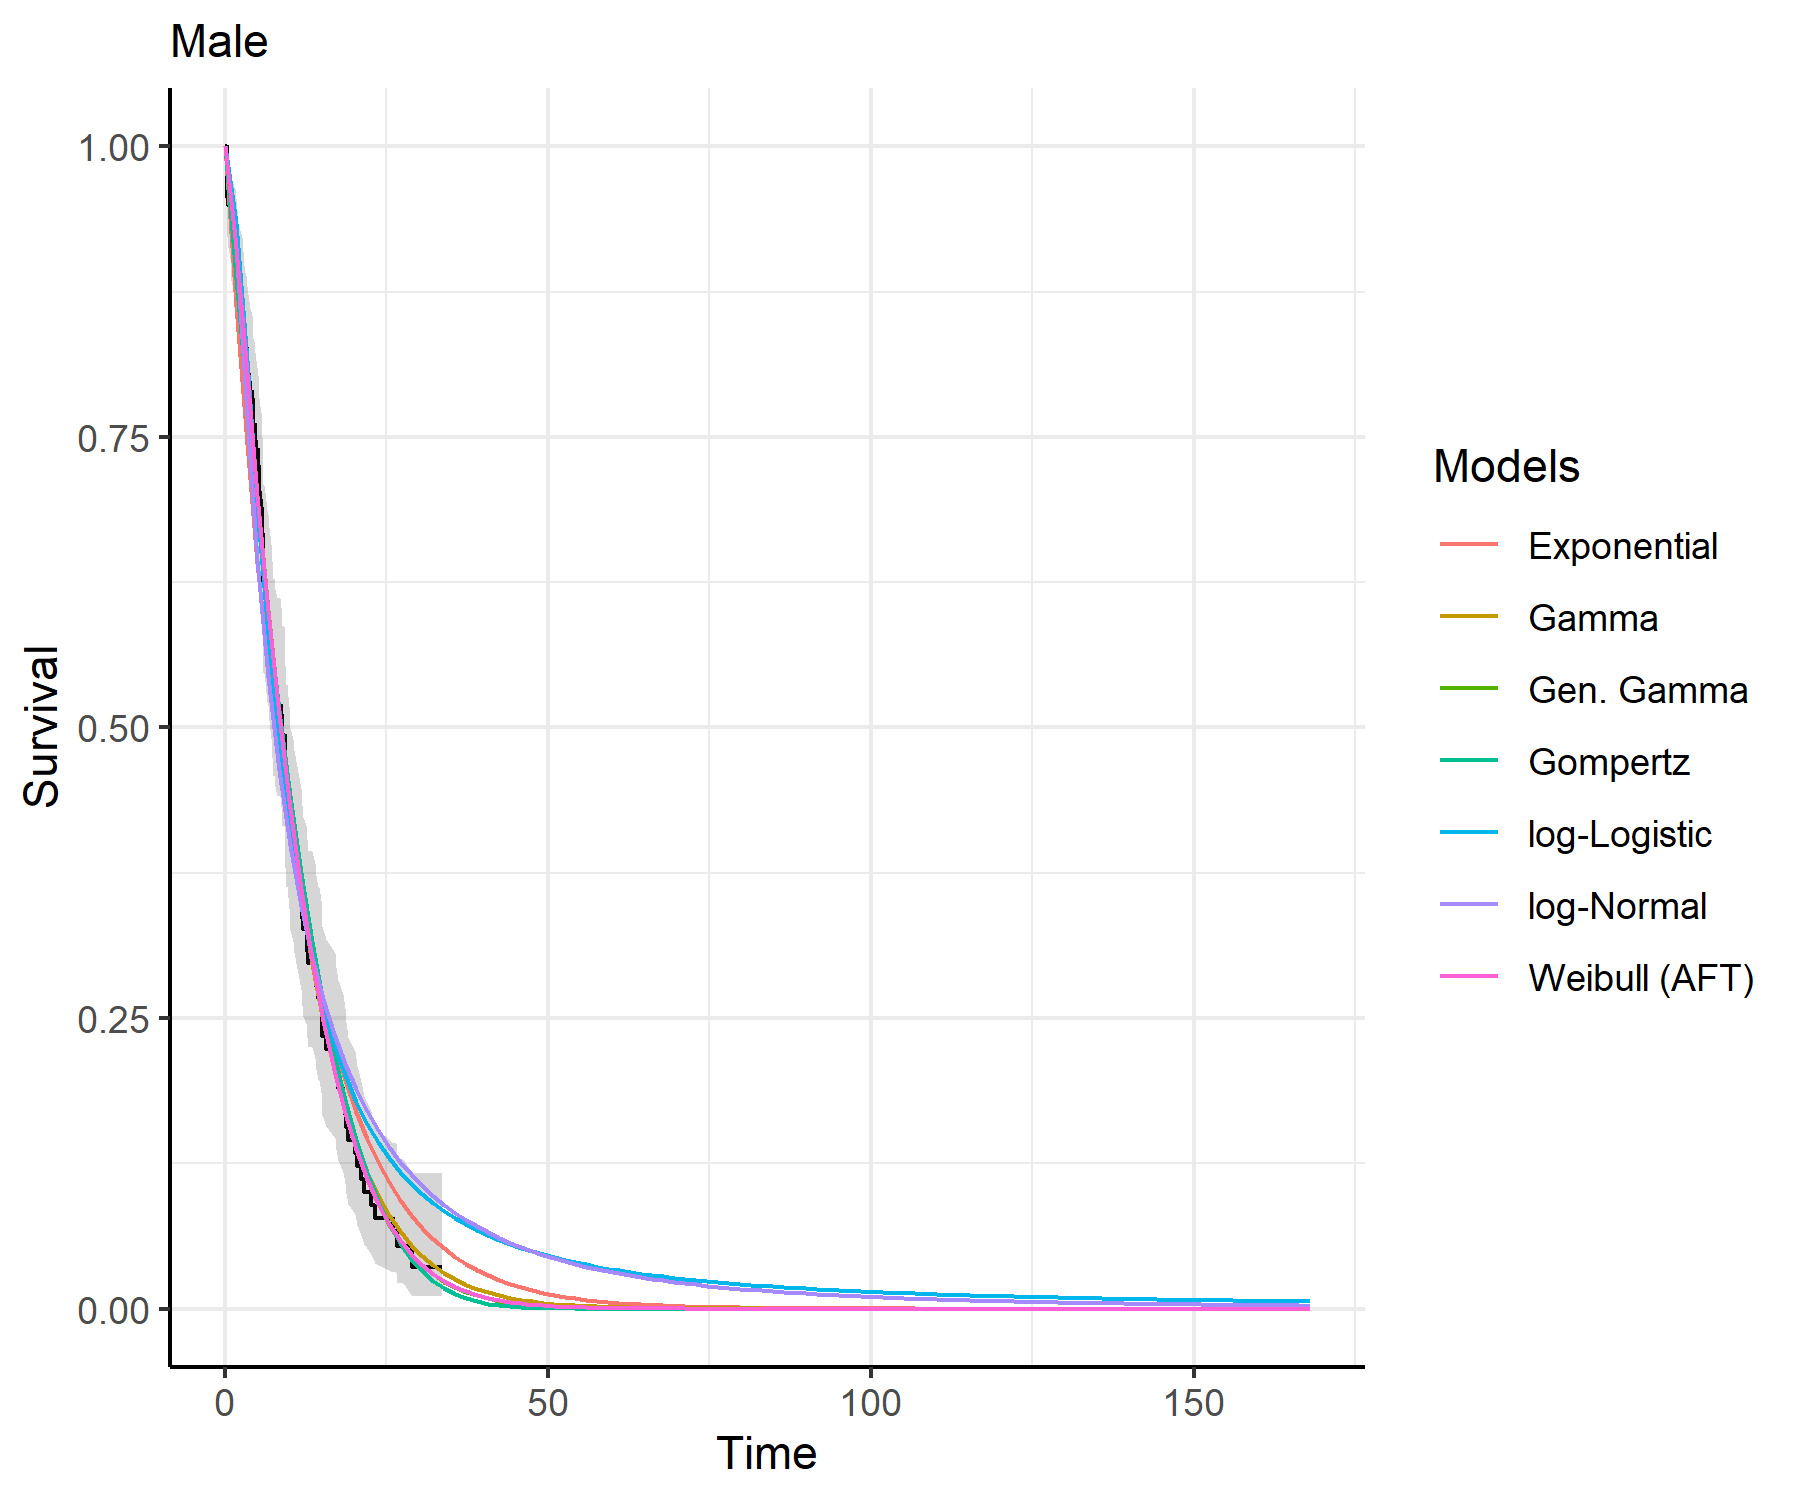
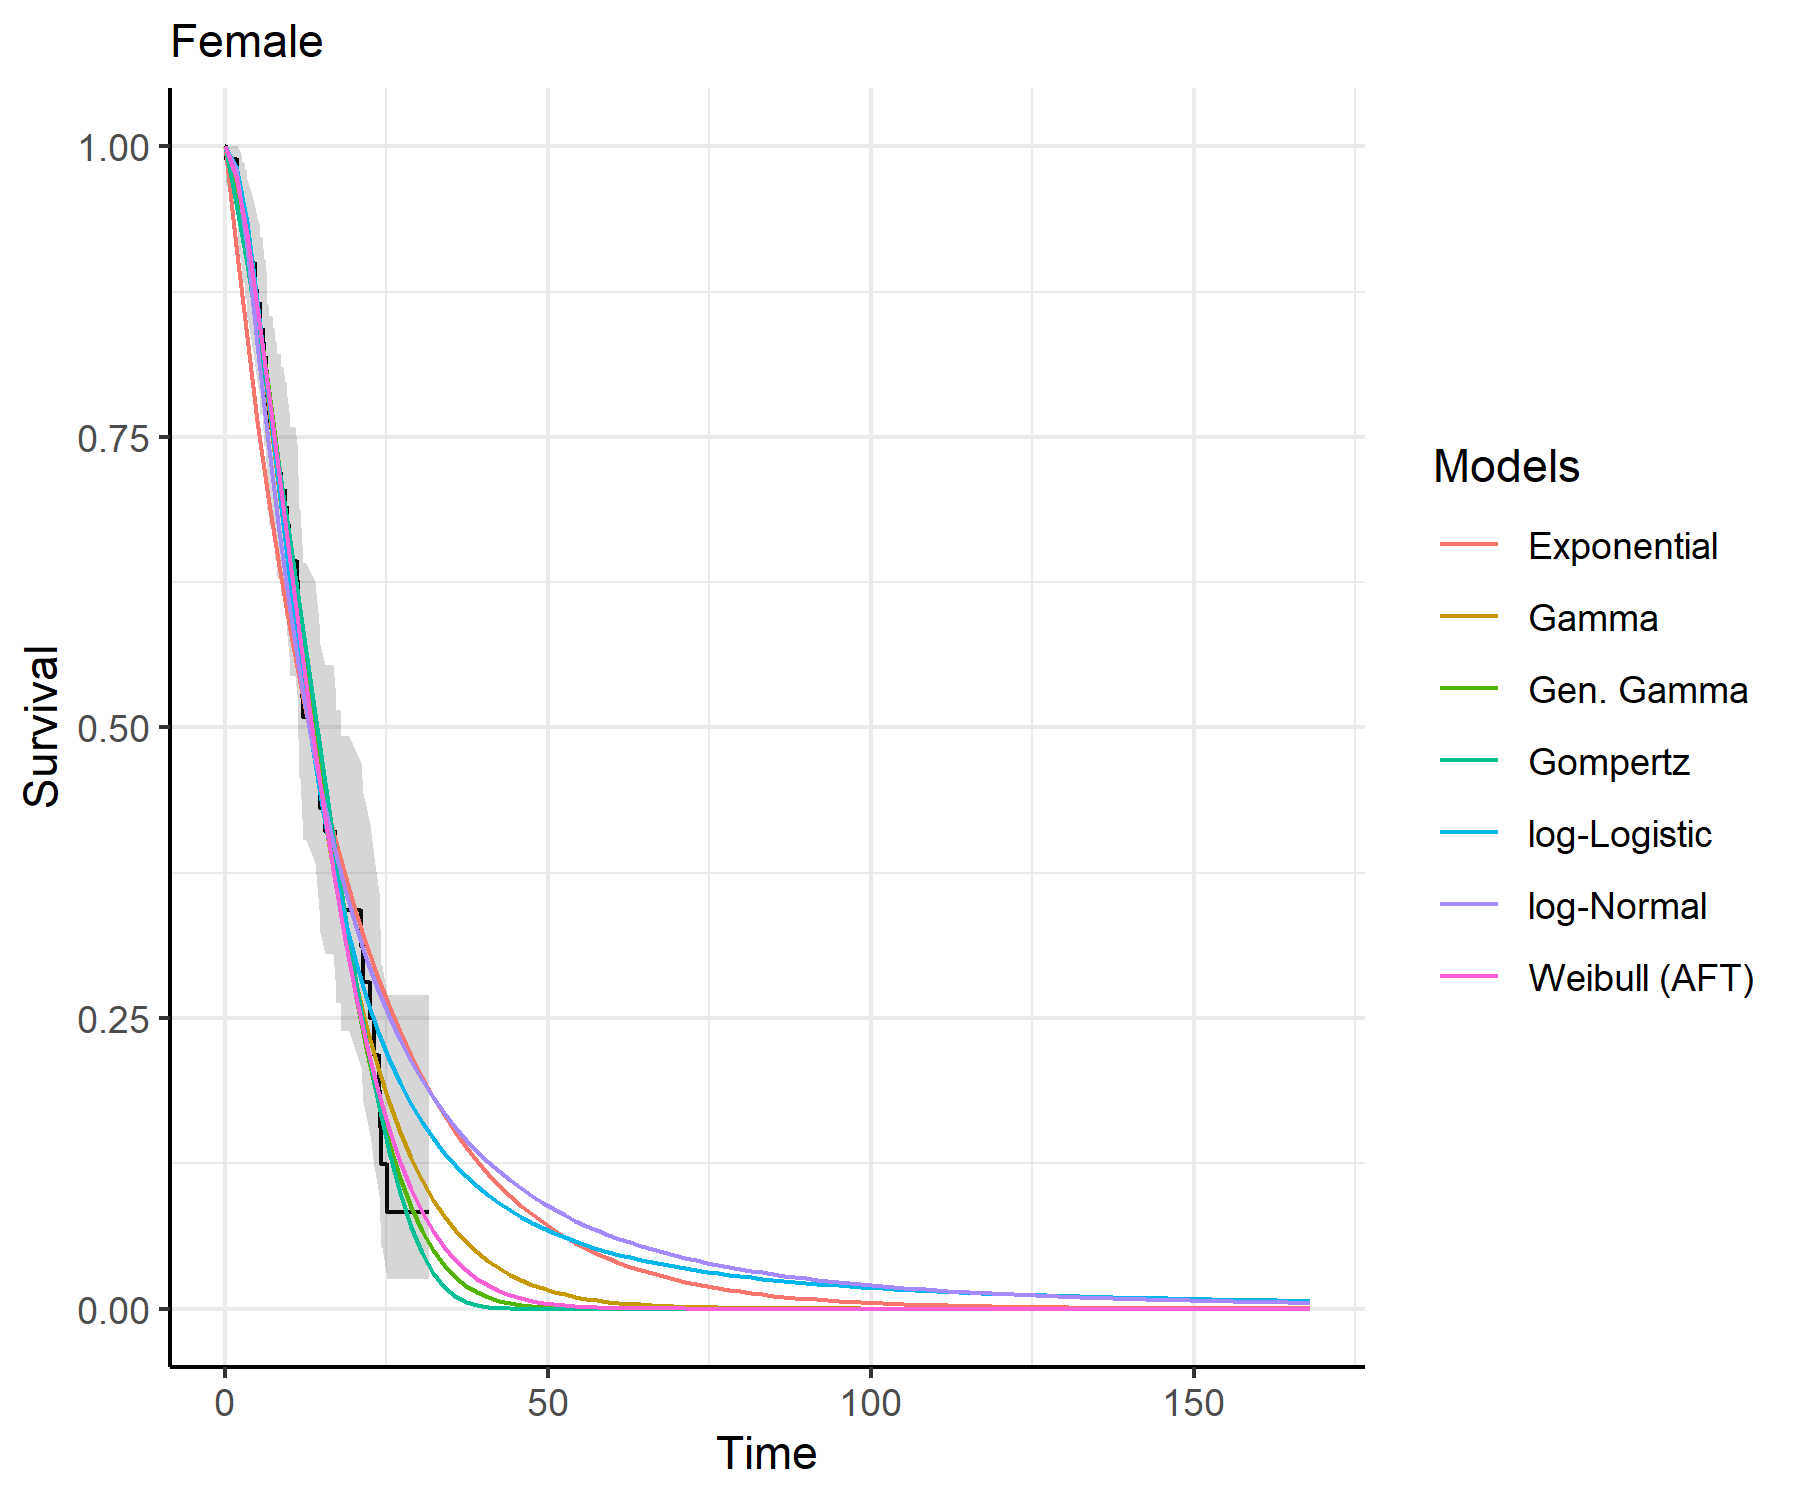
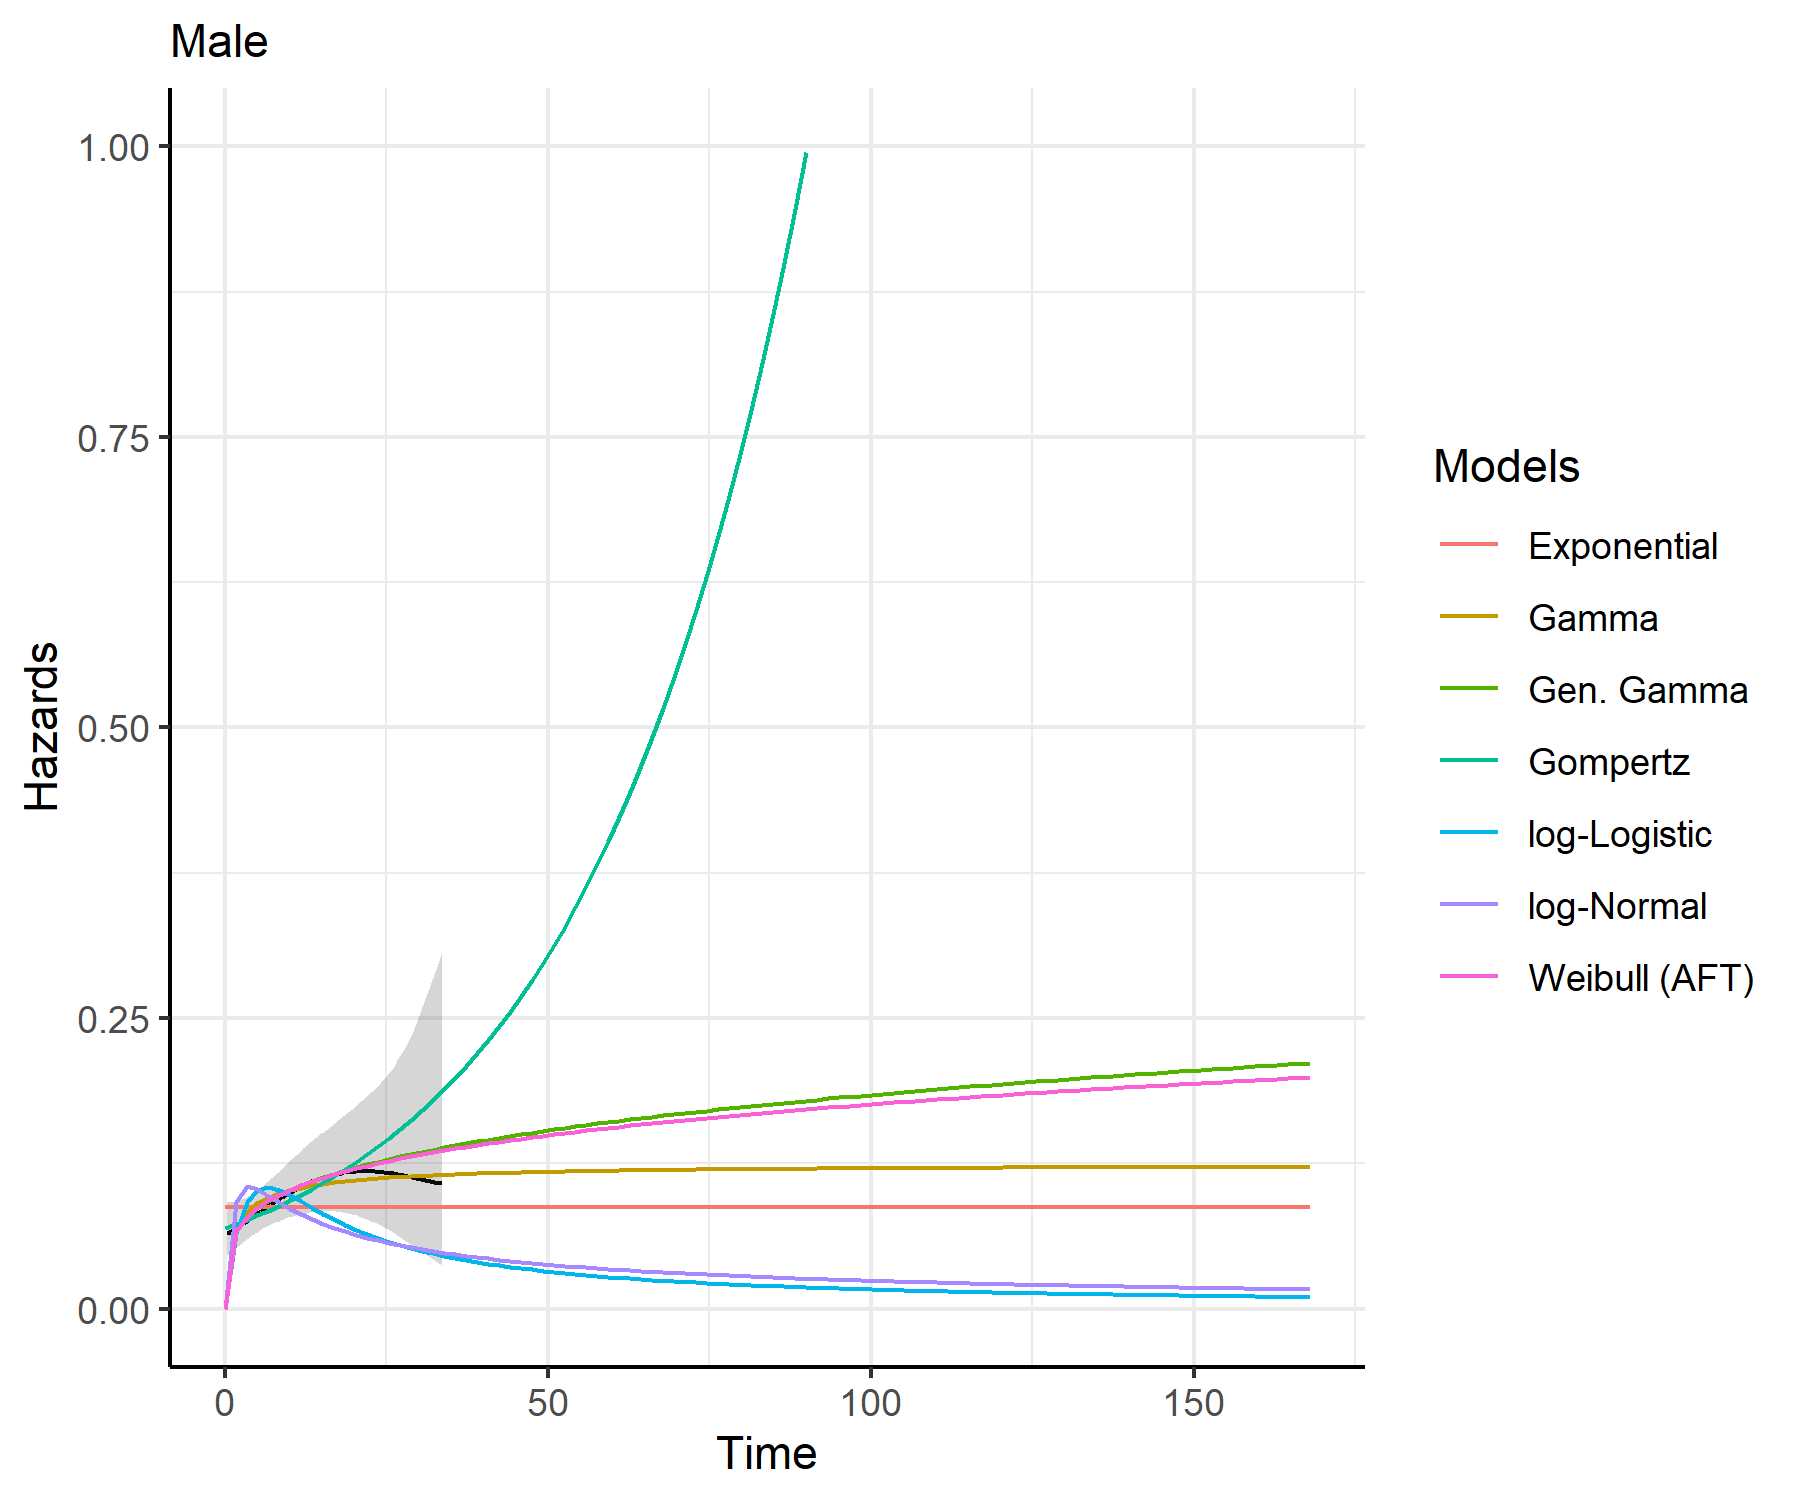
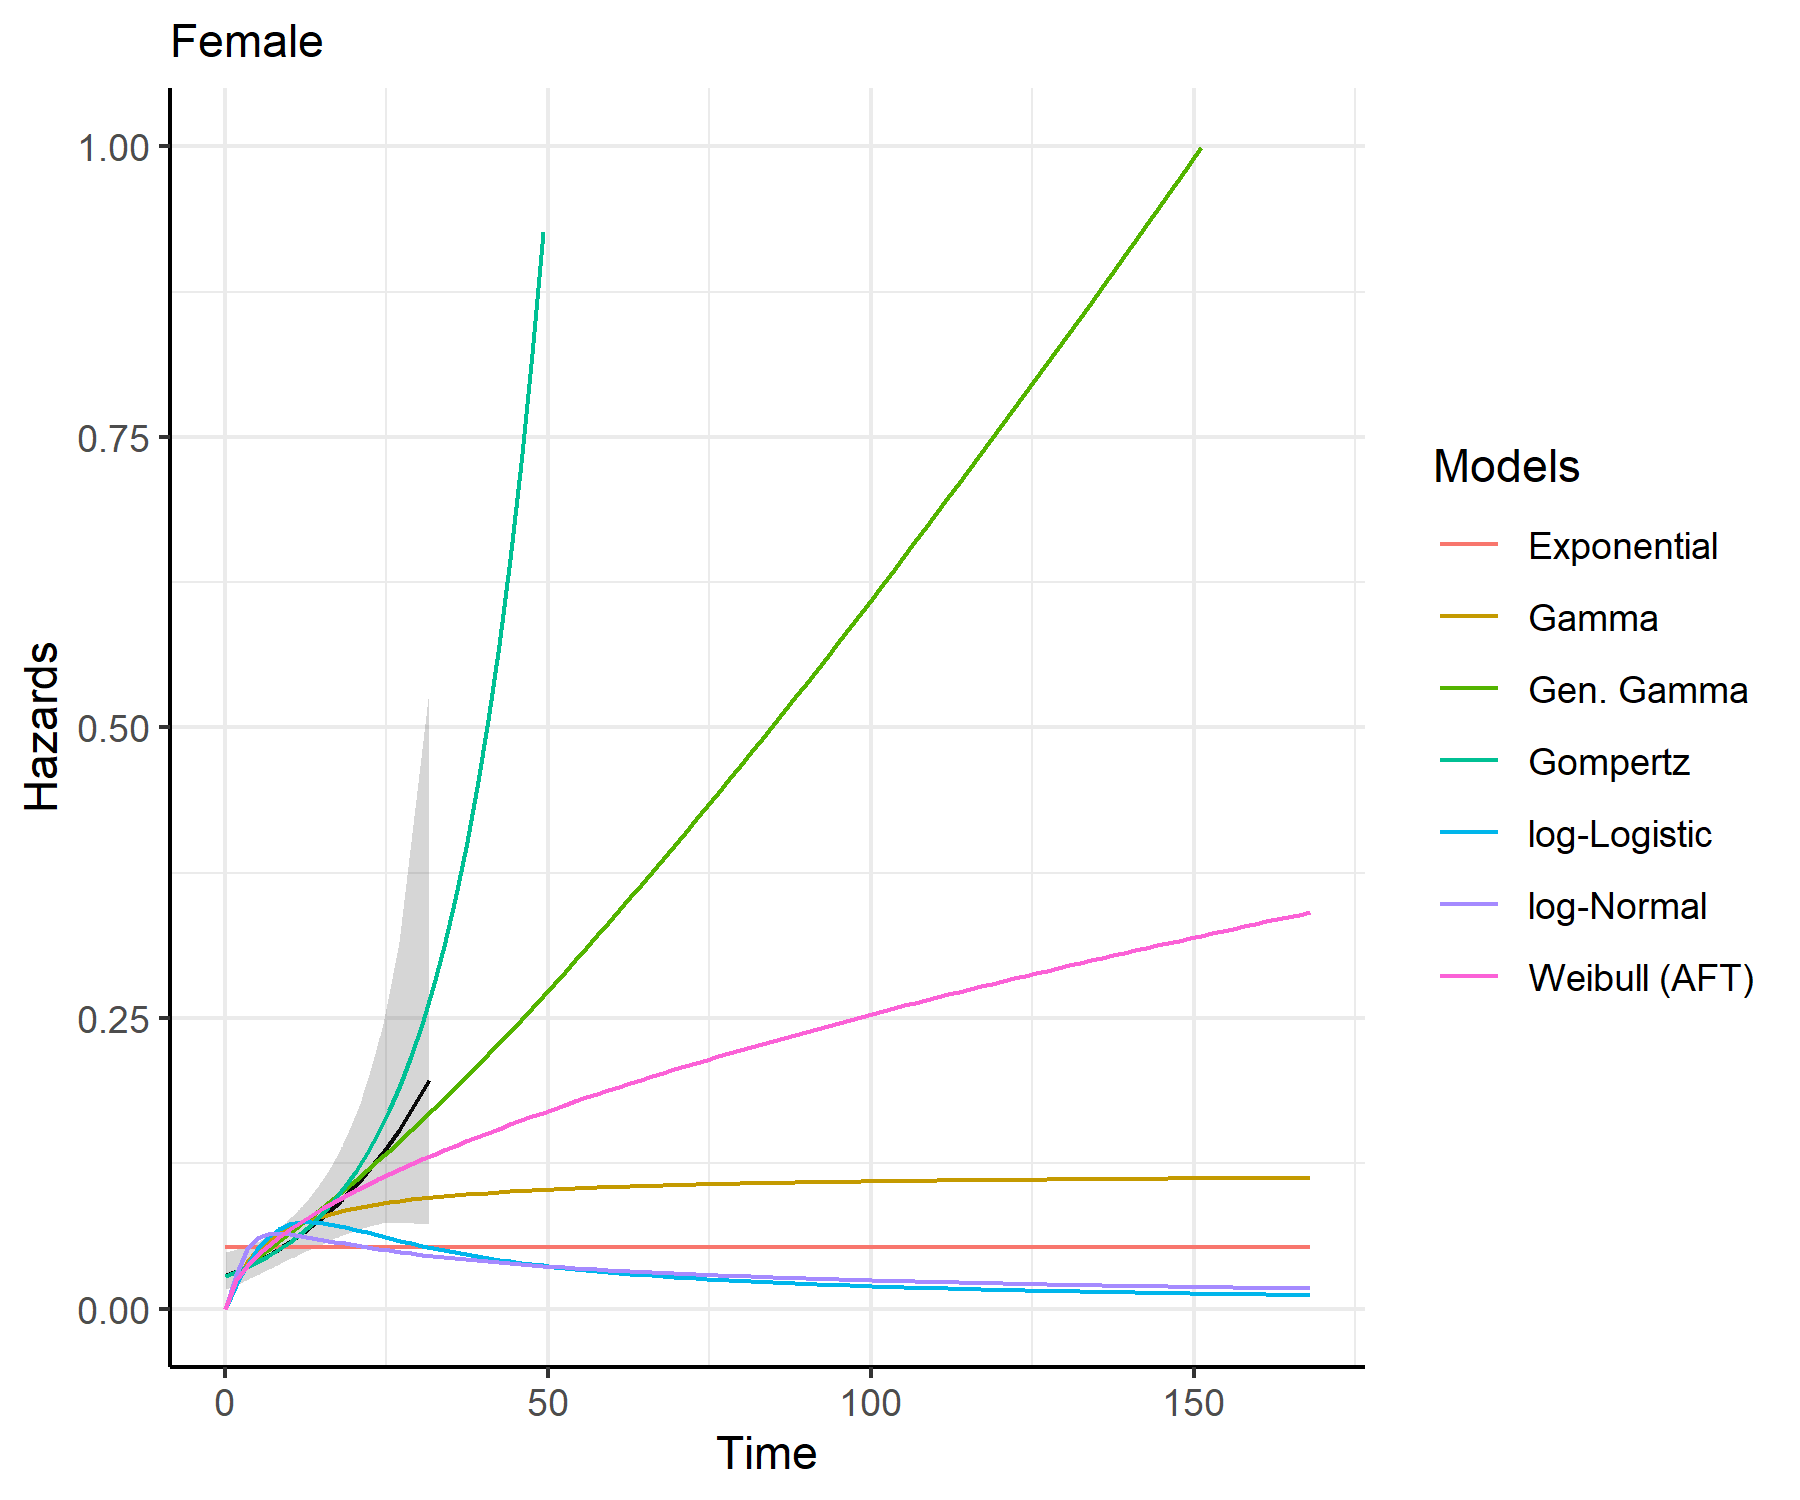
predict_and_plot()
plots <- predict_and_plot(fit_models = separate_models)

print(plots)