dropR
Dropout Analysis by Condition
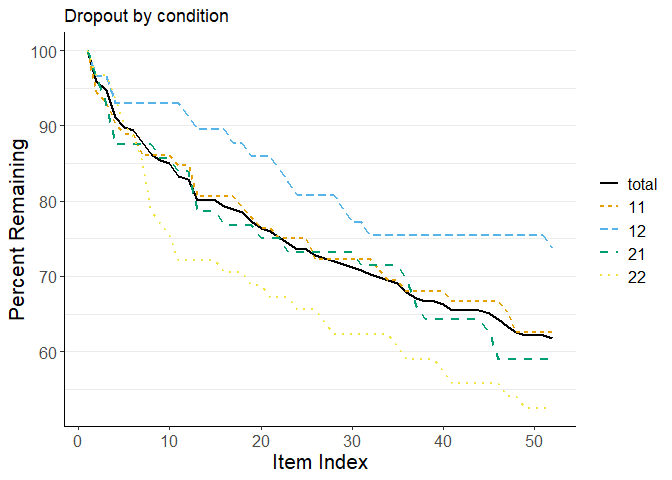
Analysis and visualization of dropout between conditions in surveys and (online) experiments. Features include computation of dropout statistics, comparing dropout between conditions (e.g. Chi squared), analyzing survival (e.g. Kaplan-Meier estimation), comparing conditions with the most different rates of dropout (Kolmogorov-Smirnov) and visualizing the result of each in designated plotting functions. Article published in _Behavior Research Methods_ on 'dropR' by the authors: Dropout analysis: A method for data from Internet-based research and 'dropR', an R-based web app and package to analyze and visualize dropout. (2025)
dropR: Dropout Analysis by Condition 
Installation
You can install the development version of dropR from
GitHub with:
# install.packages("remotes")
remotes::install_github("iscience-kn/dropR")
We are currently working to get dropR back on CRAN. Once it’s up
again, you can install dropR via
install.packages("dropR")
Usage as a Shiny App (Graphical User Interface)
To start dropR’s built-in GUI, run
dropR::start_app()
or visit the dropR Web App.
Interactive Usage (use dropR on the R Console)
You can also use dropR’s functionality within R, i.e., either in the
console or within your own functions and packages. Read more about
interactive usage of dropR in our walkthrough
article.
#> ℹ Loading dropR
#>
#> Welcome to dropR,
#> to start the interactive Graphical User Interface locally in your R session,
#> run start_app()