MapperAlgo
Topological Data Analysis: Mapper Algorithm
The Mapper algorithm from Topological Data Analysis, the steps are as follows 1. Define a filter (lens) function on the data. 2. Perform clustering within each level set. 3. Generate a complex from the clustering results.
Topological Data Analysis: Mapper Algorithm

This R package implements the Mapper algorithm for topological data analysis (TDA). The Mapper algorithm facilitates visualisation and analysis of high-dimensional data by constructing a simplicial complex that represents the data's underlying structure. The package offers the standard Mapper F-Mapper and G-Mapper algorithms, in addition to multiple clustering methods and visualisation tools.
Get started quickly
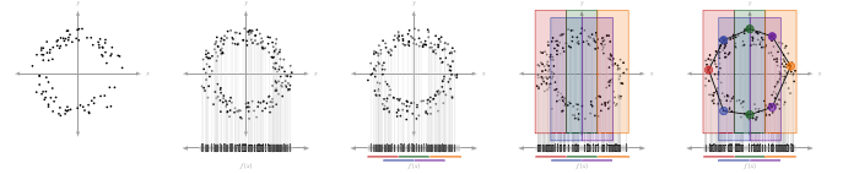 Step visualize from Skaf et al.
Mapper is basically a three-step process:
1. Cover: This step splits the data into overlapping intervals and creates a cover for the data.
2. Cluster: This step clusters the data points in each interval the cover creates.
3. Simplicial Complex: This step combines the two steps above to connect the data points in the cover, creating a simplicial complex.
You can learn more about the basics here: Chazal, F., & Michel, B. (2021). An introduction to topological data analysis: fundamental and practical aspects for data scientists. Frontiers in artificial intelligence, 4, 667963.
Examples
More examples could be found in inst/example with function applications. For a more detailed explanation of this package, this document will be kept updated for better understanding of the source code.
data <- get(data("iris"))

Mapper <- MapperAlgo(
  data[,1:4],
  filter_values = data[,1:3],
  percent_overlap = 20,
  methods = "kmeans",
  method_params = list(max_kmeans_clusters = 2),
  cover_type = 'stride',
  interval_width = 1,
  num_cores = 12
  )
FMapper <- FuzzyMapperAlgo(
  original_data = data[,1:4],
  filter_values =  data[,1:2],
  cluster_n = 8,
  fcm_threshold = 0.2,
  methods = "kmeans",
  method_params = list(max_kmeans_clusters = 2)
)
GMapper <- GMapperAlgo(
  data[,1:4],
  filter_values = data[,1],
  AD_threshold = 0.8,
  g_overlap = 0.5,
  methods = "kmeans",
  method_params = list(max_kmeans_clusters = 2),
  num_cores = 12
)

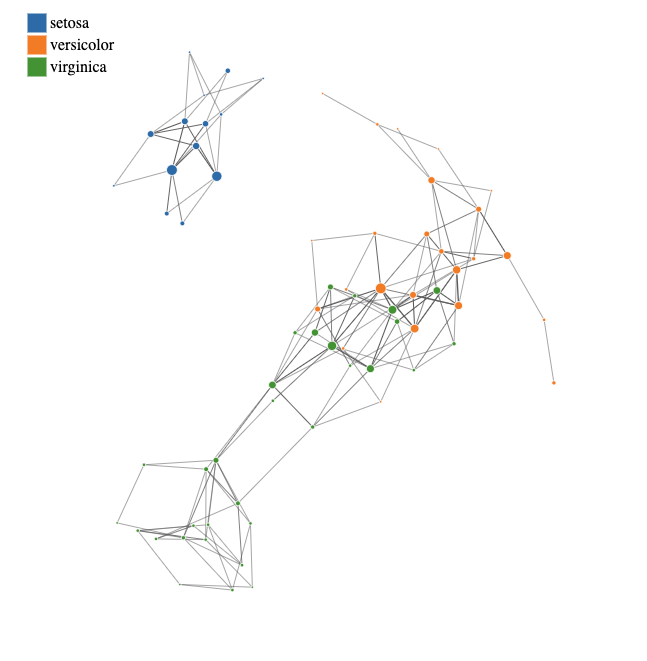
MapperPlotter(Mapper, label=data$Species, avg=FALSE, use_embedding=FALSE)
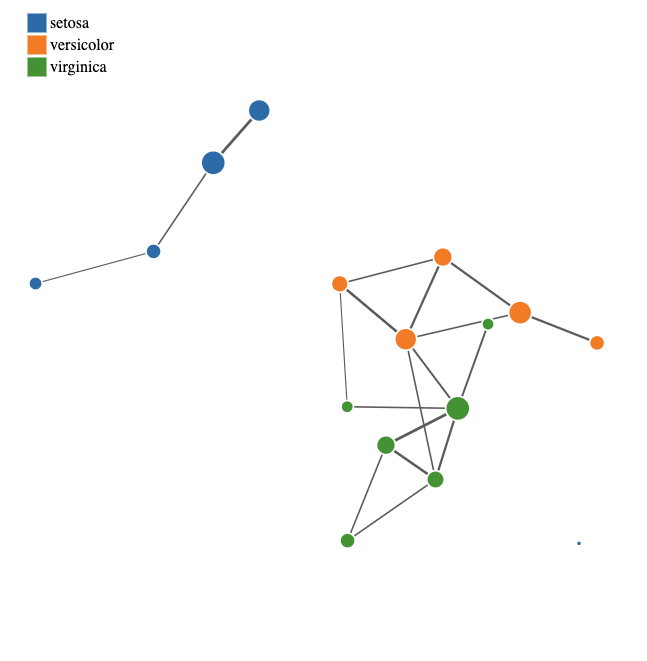
MapperPlotter(FMapper, label=data$Species, avg=FALSE, use_embedding=FALSE)
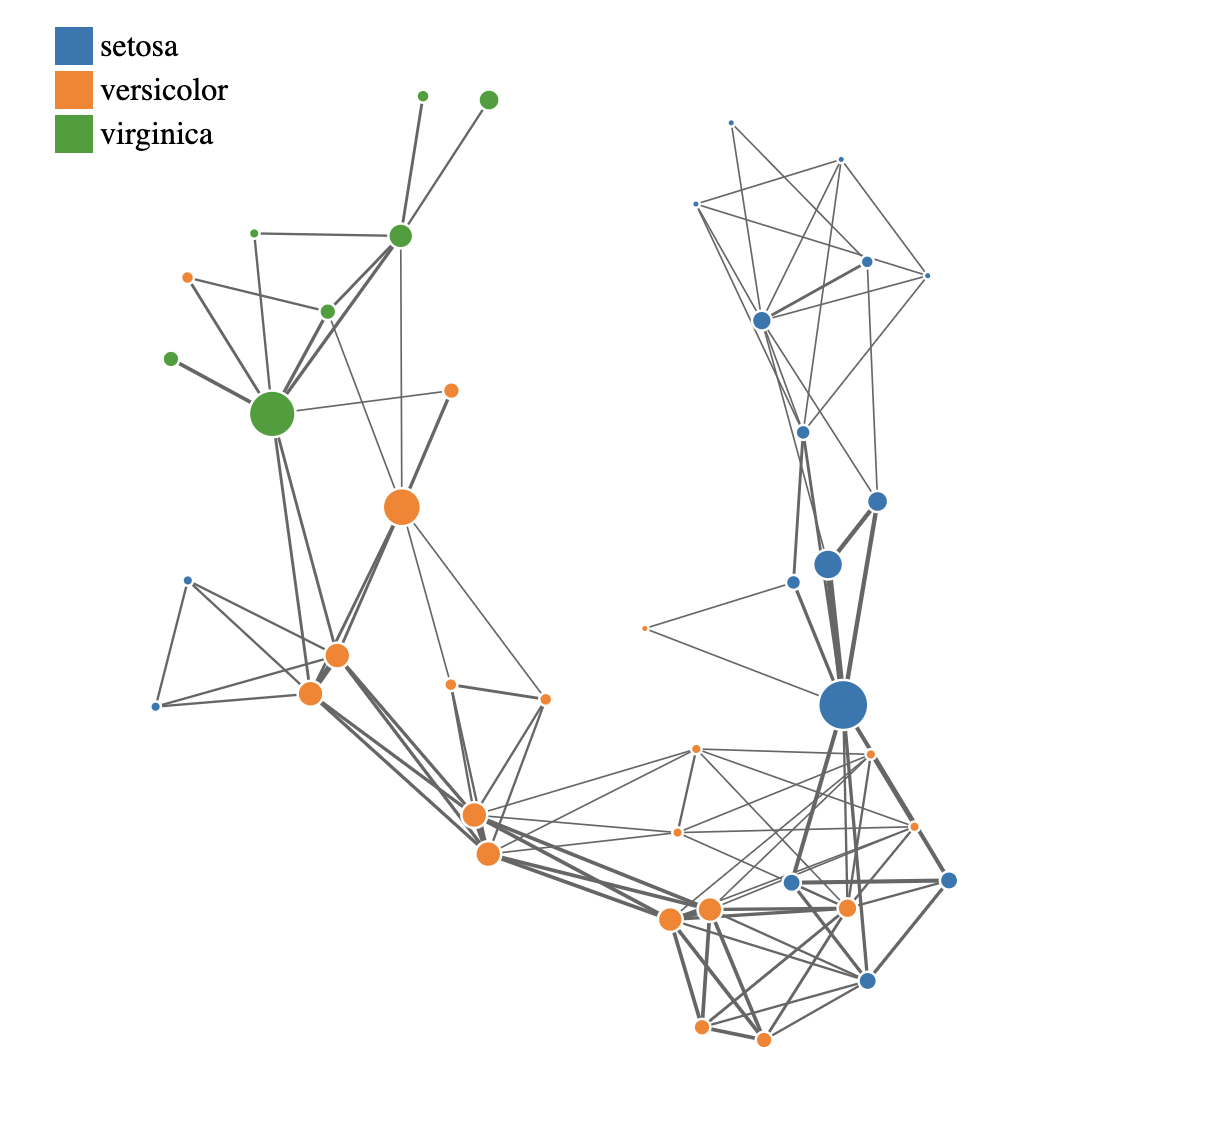
MapperPlotter(GMapper, label=data$Species, avg=FALSE, use_embedding=FALSE)
 |
 |
 |
|---|---|---|
| Mapper | F-Mapper | G-Mapper |
Frontend
You can try the interactive frontend in tda frontend. To visualise your own data, upload a JSON file formatted as shown below. The cc is optional; you can ignore it unless you have pre-calculated labels. Any feedback is welcome; please send it to [email protected] or add an issue.
library(jsonlite)

export_data <- list(
  adjacency = Mapper$adjacency,
  num_vertices = Mapper$num_vertices,
  level_of_vertex = Mapper$level_of_vertex,
  points_in_vertex = Mapper$points_in_vertex,
  original_data = as.data.frame(all_features),
  # This is the label that is already calculated for each node (optional)
  cc = tibble(
    eigen_centrality = e_scores,
    betweenness = b_scores
  )
)
write(toJSON(export_data, auto_unbox = TRUE), "~/desktop/frontend.json")