tidypaleo
Tidy Tools for Paleoenvironmental Archives
Provides a set of functions with a common framework for age-depth model management,
stratigraphic visualization, and common statistical transformations. The focus of the
package is stratigraphic visualization, for which 'ggplot2' components are provided
to reproduce the scales, geometries, facets, and theme elements commonly used in
publication-quality stratigraphic diagrams. Helpers are also provided to reproduce
the exploratory statistical summaries that are frequently included on
stratigraphic diagrams. See Dunnington et al. (2021)
tidypaleo


Working with multi-proxy paleo-archive data can be difficult. There are multiple locations, multiple parameters, and a lot of discipline-specific norms for plot layout and notation. This package simplifies a few workflows to promote the use of R for reproducible documents in paleo-based studies.
Installation
You can install the released versio of tidypaleo from CRAN with:
install.packages("tidypaleo")
You can install the development version from GitHub with:
# install.packages("remotes")
remotes::install_github("paleolimbot/tidypaleo")
Examples
Strat diagrams
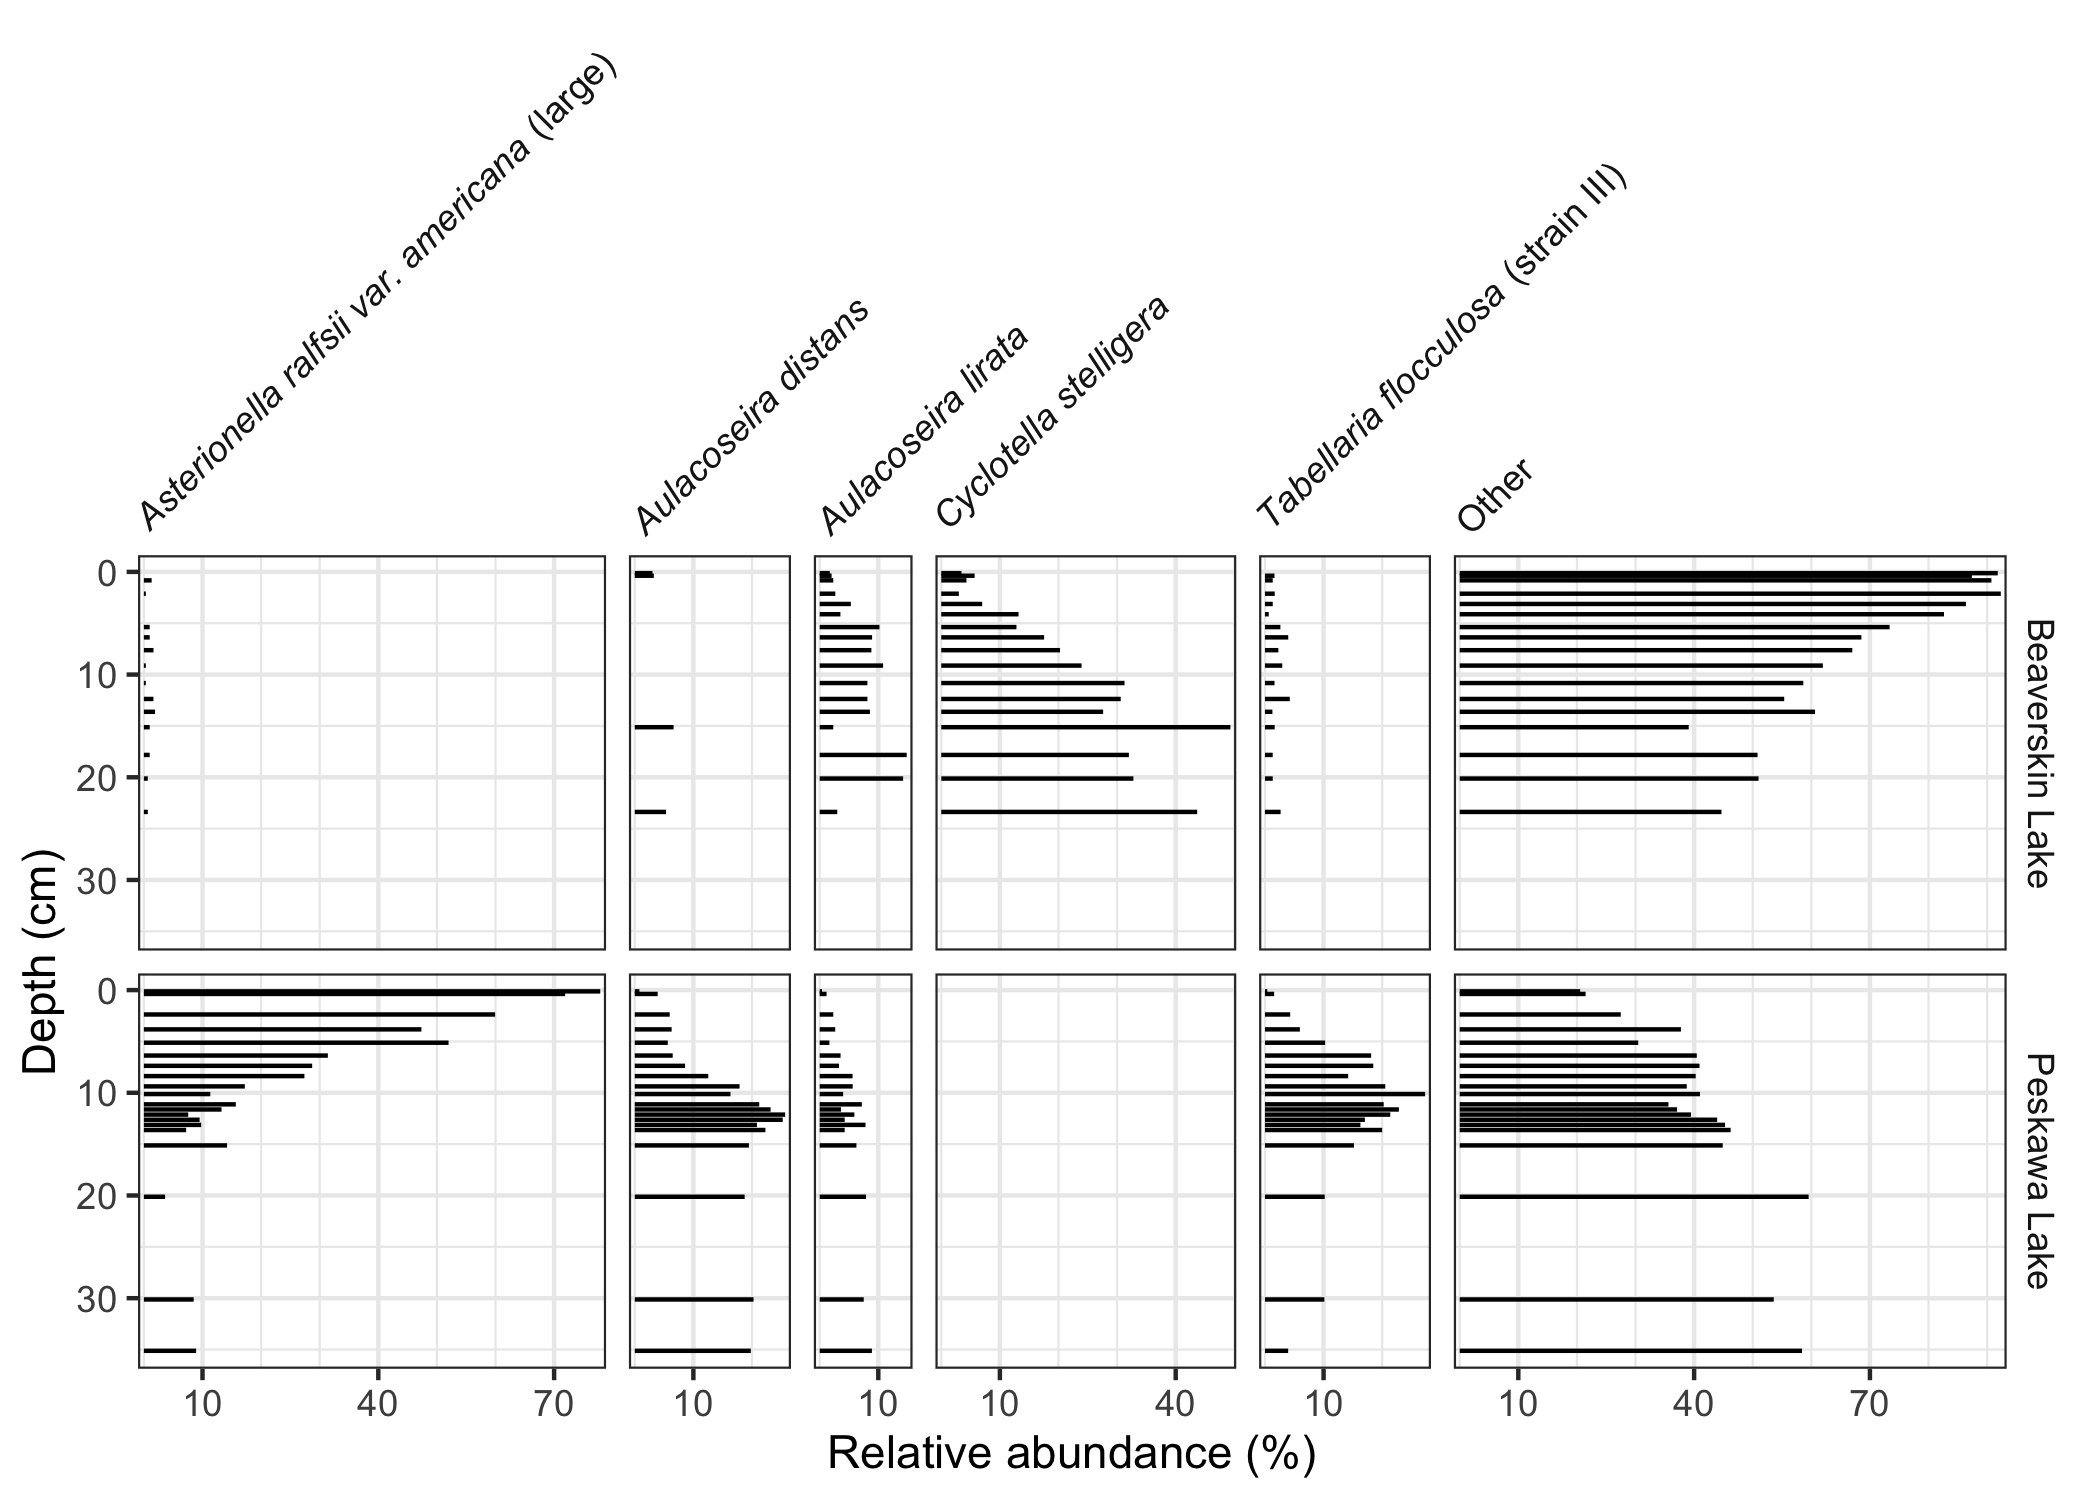
This package exposes a number of functions useful when creating
stratigraphic diagrams, including facet_abundanceh(), which combines
several other functions to help create stratigraphic plots using
ggplot2. The geom_col_segsh() geometry draws horizontal segments,
which are commonly used to show species abundance data.
library(ggplot2)
library(tidypaleo)
theme_set(theme_paleo())

ggplot(keji_lakes_plottable, aes(x = rel_abund, y = depth)) +
  geom_col_segsh() +
  scale_y_reverse() +
  facet_abundanceh(vars(taxon), grouping = vars(location)) +
  labs(y = "Depth (cm)")