surveil
Time Series Models for Disease Surveillance
Fits time trend models for routine disease surveillance tasks and returns probability distributions for a variety of quantities of interest, including age-standardized rates, period and cumulative percent change, and measures of health inequality. The models are appropriate for count data such as disease incidence and mortality data, employing a Poisson or binomial likelihood and the first-difference (random-walk) prior for unknown risk. Optionally add a covariance matrix for multiple, correlated time series models. Inference is completed using Markov chain Monte Carlo via the Stan modeling language. References: Donegan, Hughes, and Lee (2022)
surveil: Public health surveillance

The surveil R package provides time series models for routine public health surveillance tasks: model time trends in mortality or disease incidence rates to make inferences about levels of risk, cumulative and period percent change, age-standardized rates, and health inequalities.
surveil is an interface to Stan, a state-of-the-art platform for Bayesian inference. For analysis of spatial health data see the geostan R package.
Installation
surveil is available on CRAN; install from R using:
install.packages("surveil")
Vignettes
Review the package vignettes to get started:
vignette("demonstration"): An introduction to health modeling with surveilvignette("age-standardization"): How to age-standardize surveil model results and compare age-stratified populations
Also see the online documentation.
Usage
Model time series data of mortality or disease incidence by loading the surveil package into R together with disease surveillance data. Tables exported from CDC WONDER are automatically in the correct format.
library(surveil)
library(knitr)
data(cancer)

kable(head(cancer),
      booktabs = TRUE,
      caption = "Table 1. A glimpse of cancer surveillance data")
| Year | Age | Count | Population |
|---|---|---|---|
| 1999 | <1 | 866 | 3708753 |
| 1999 | 1-4 | 2959 | 14991152 |
| 1999 | 5-9 | 2226 | 20146188 |
| 1999 | 10-14 | 2447 | 19742631 |
| 1999 | 15-19 | 3875 | 19585857 |
| 1999 | 20-24 | 5969 | 18148795 |
Model trends in risk and easily view functions of risk estimates, such as cumulative percent change:
fit <- stan_rw(data = cancer,
               time = Year,
               group = Age,
           cores = 4 # multi-core processing for speed
           )

fit_apc <- apc(fit)
plot(fit_apc, cumulative = TRUE)
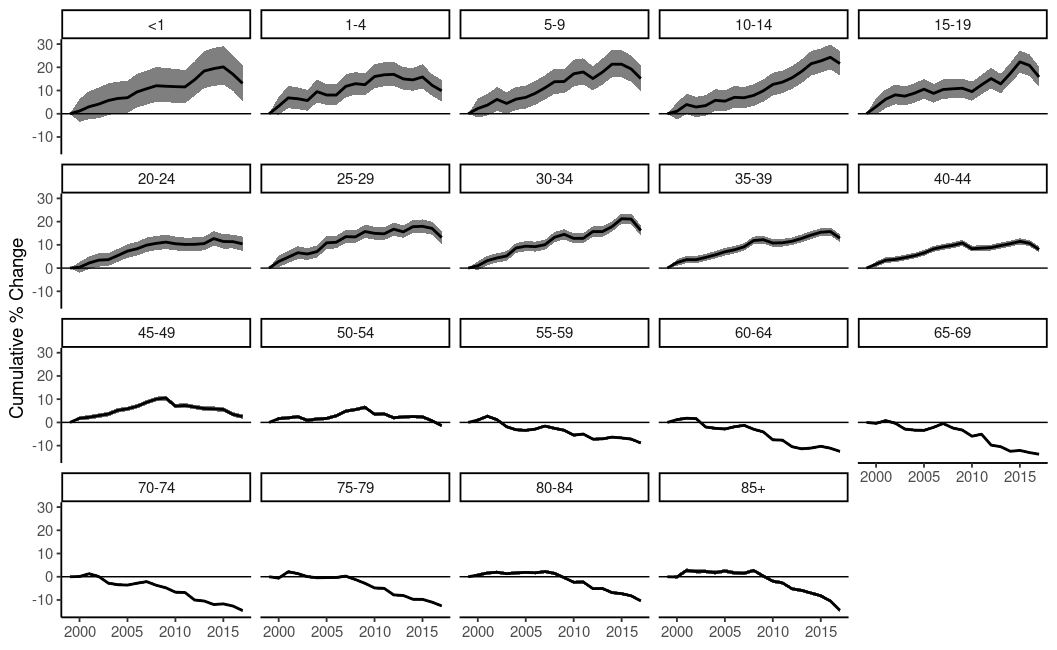 *Cumulative percent change in US cancer incidence by age group*