parcats
Interactive Parallel Categories Diagrams for 'easyalluvial'
Complex graphical representations of data are best explored using interactive elements. 'parcats' adds interactive graphing capabilities to the 'easyalluvial' package. The 'plotly.js' parallel categories diagrams offer a good framework for creating interactive flow graphs that allow manual drag and drop sorting of dimensions and categories, highlighting single flows and displaying mouse over information. The 'plotly.js' dependency is quite heavy and therefore is outsourced into a separate package.
parcats 


Create ‘plotly.js’ Parallel Categories Diagrams Using this Htmlwidget and ‘easyalluvial’
Complex graphical representations of data are best explored using interactive elements. ‘parcats’ adds interactive graphing capabilities to the ‘easyalluvial’ package. The ‘plotly.js’ parallel categories diagrams offer a good framework for creating interactive flow graphs that allow manual drag and drop sorting of dimensions and categories, highlighting single flows and displaying mouse over information. The ‘plotly.js’ dependency is quite heavy and therefore is outsourced into a separate package.
Installation
CRAN
install.packages('parcats')
Development Version
# install.packages("devtools")
devtools::install_github("erblast/parcats")
easyalluvial
parcats requires an alluvial plot created with easyalluvial to
create an interactive parrallel categories diagram.
Examples
suppressPackageStartupMessages(require(tidyverse))
suppressPackageStartupMessages(require(easyalluvial))
suppressPackageStartupMessages(require(parcats))
Shiny Demo
The shiny demo allows you to interactively explore the parameters of
alluvial_wide() and parcats()
parcats_demo()
Live Widget
The Htmlwidgets cannot be embedded in the README.md file. Check out
the Live Widget
here.
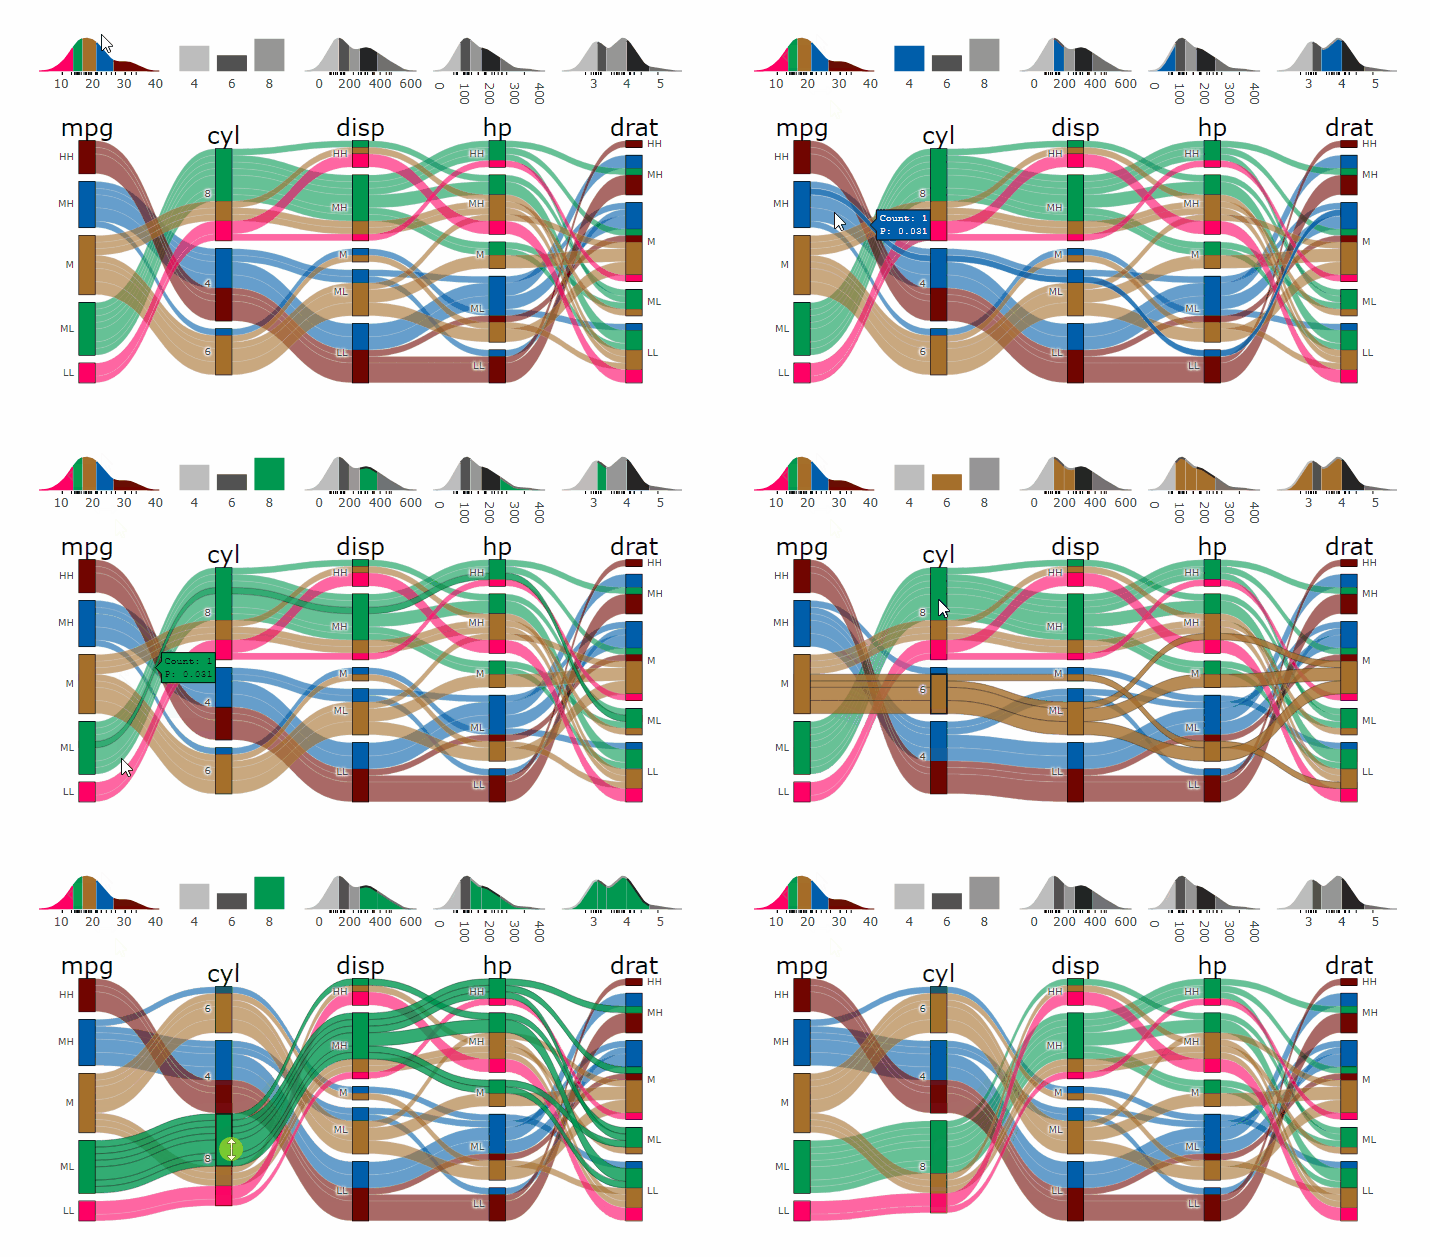
Parcats from alluvial from data in wide format
p <- alluvial_wide(mtcars2, max_variables = 5)

parcats(p, marginal_histograms = TRUE, data_input = mtcars2)
Parcats from model response alluvial
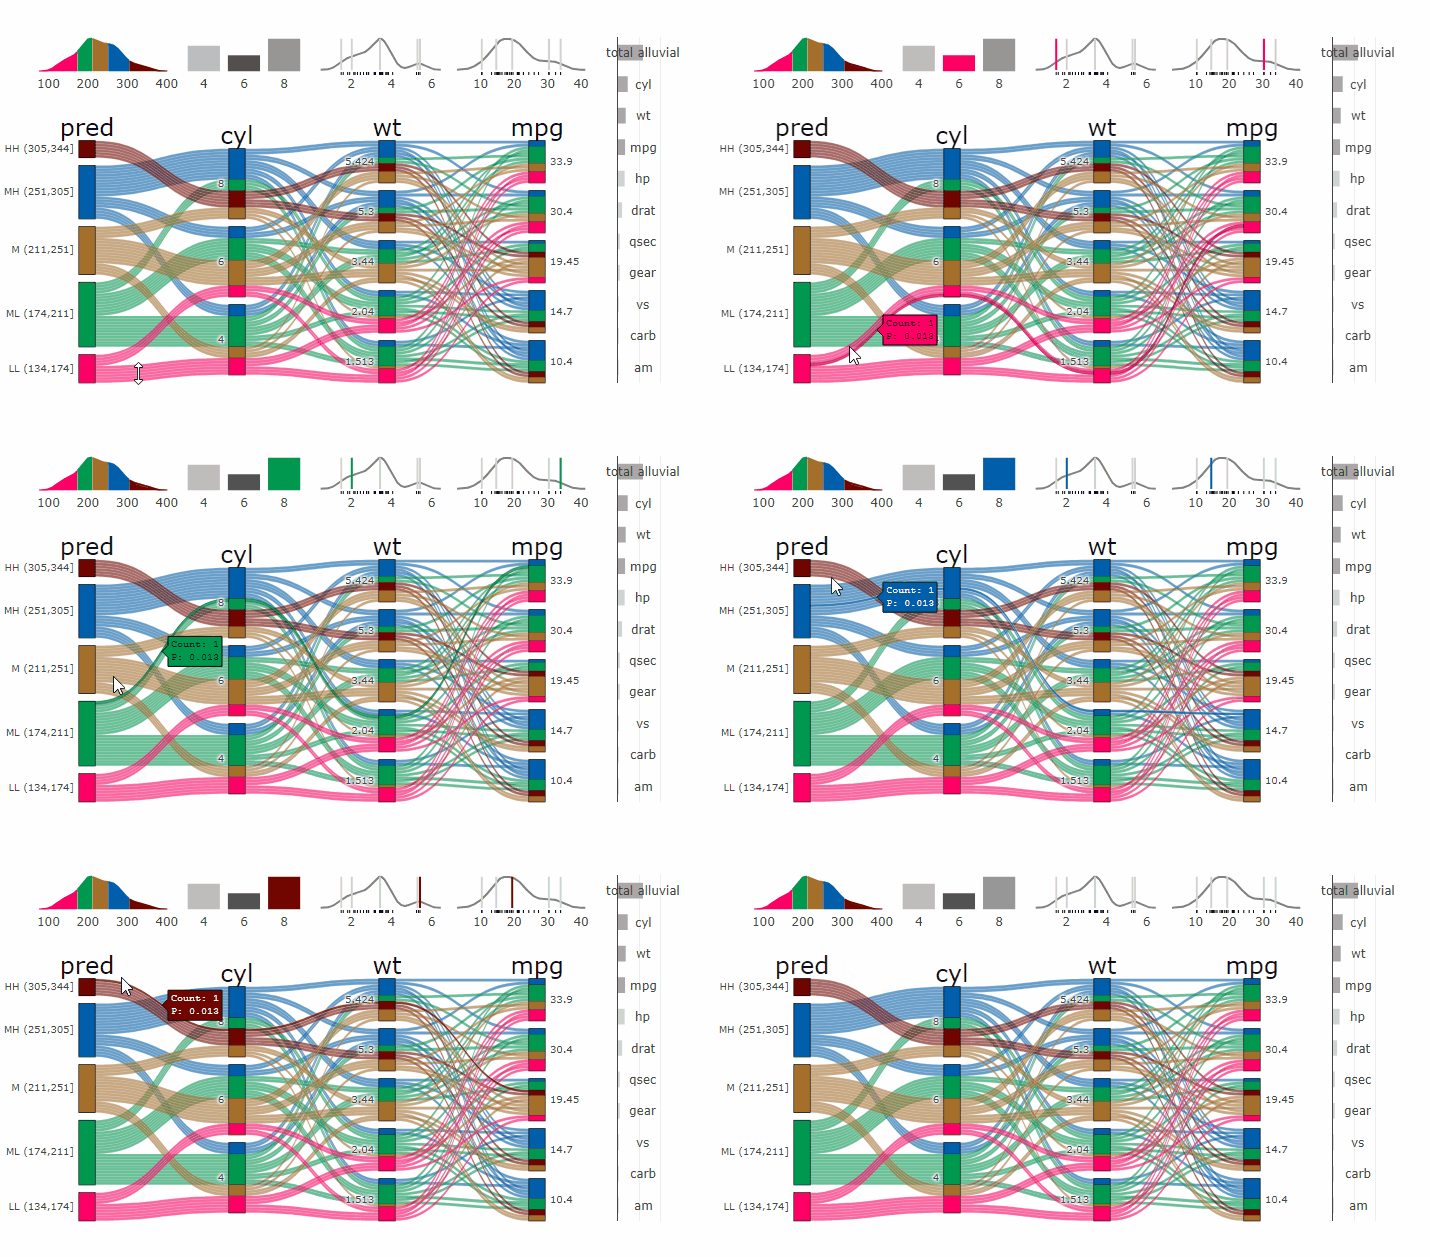
Machine Learning models operate in a multidimensional space and their response is hard to visualise. Model response and partial dependency plots attempt to visualise ML models in a two dimensional space. Using alluvial plots or parrallel categories diagrams we can increase the number of dimensions.
Here we see the response of a random forest model if we vary the three variables with the highest importance while keeping all other features at their median/mode value.
df <- select(mtcars2, -ids )
m <- randomForest::randomForest( disp ~ ., df)
imp <- m$importance
dspace <- get_data_space(df, imp, degree = 3)
pred <- predict(m, newdata = dspace)
p <- alluvial_model_response(pred, dspace, imp, degree = 3)

parcats(p, marginal_histograms = TRUE, imp = TRUE, data_input = df)