leaflet.minicharts
Mini Charts for Interactive Maps
Add and modify small charts on an interactive map created with package 'leaflet'. These charts can be used to represent at same time multiple variables on a single map.
leaflet.minicharts
Minicharts for dynamic {leaflet} maps
For a few years now, it has become easy to create interactive maps with R thanks to the package leaflet by the Rstudio team. Nevertheless, it only provides only a few functions to create basic shapes on a map, so the information that can be represented on a single map is limited: if you have some data associated to some points, you can only represent at most two variables by drawing circles and changing their radius and color according to data.
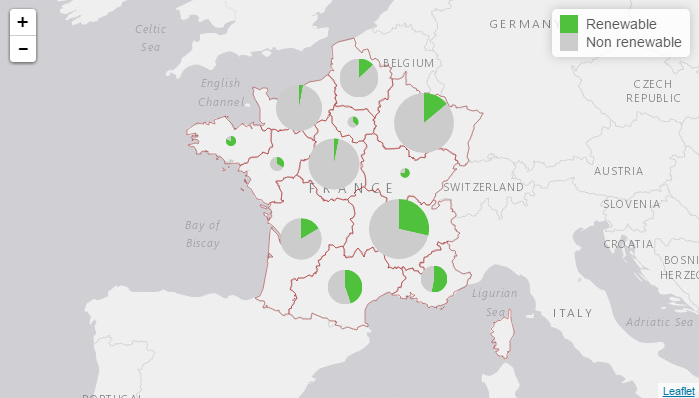
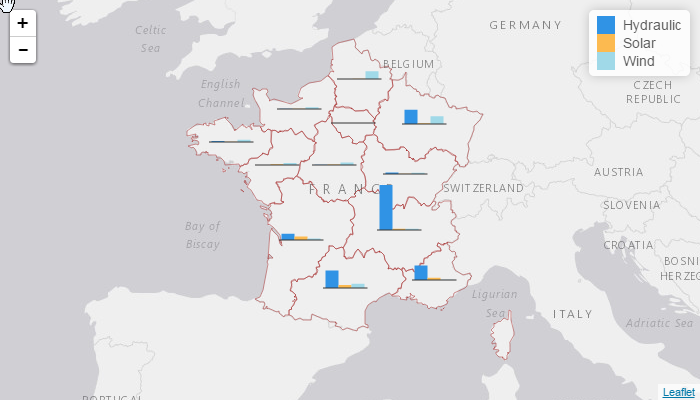
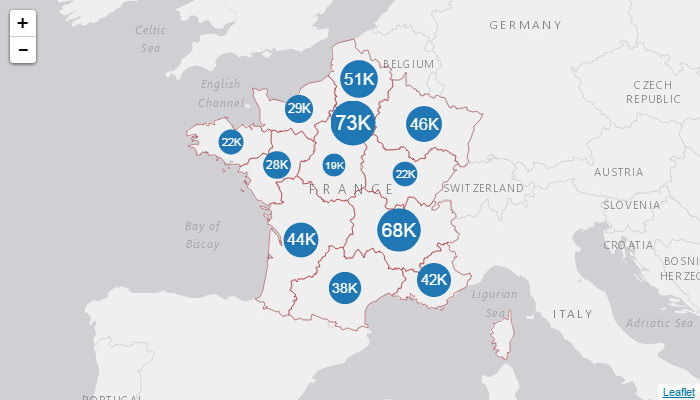
leaflet.minicharts is an R package that provides two functions to add and update small charts on an interactive maps created with the package leaflet. These charts can be used to represent as many variables as desired associated to geographical points. Currently, three types of chart are supported: barcharts (the default), pie charts and polar area charts (with two variants: "polar-area" and "polar-radius", where values are represented respectively by the area or the radius of the slices).
Here are screenshots of sample outputs:
Installation and usage
You can install the package from CRAN:
install.packages("leaflet.minicharts")
To see how simple it is to use this package, have a look at the package vignette.
Contributing
Contributions to the library are welcome and can be submitted in the form of pull requests to this repository:
https://github.com/rte-antares-rpackage/leaflet.minicharts
This package contains some javascript code. To modify it requires npm and grunt. First modify files in the javascript folder. Then in a terminal, run the following commands:
cd javascript
npm install
grunt build
License Information
Copyright 2015-2018 RTE (France)
This Source Code is subject to the terms of the GNU General Public License, version 2 or any higher version. If a copy of the GPL-v2 was not distributed with this file, You can obtain one at https://www.gnu.org/licenses/old-licenses/gpl-2.0.en.html.