labNorm
Normalize Laboratory Measurements by Age and Sex
Provides functions for normalizing standard laboratory measurements (e.g. hemoglobin, cholesterol levels) according to age and sex, based on the algorithms described in "Personalized lab test models to quantify disease potentials in healthy individuals" (Netta Mendelson Cohen, Omer Schwartzman, Ram Jaschek, Aviezer Lifshitz, Michael Hoichman, Ran Balicer, Liran I. Shlush, Gabi Barbash & Amos Tanay,
labNorm 




labNorm provides functions for normalizing standard laboratory
measurements (e.g. hemoglobin, cholesterol levels) according to age and
sex. These normalizations are based on the algorithms described in the
research paper “Personalized lab test models to quantify disease
potentials in healthy
individuals”.
This package allows users to easily obtain normalized values for their lab results and to project them on the population distribution. It can use reference distributions from Clalit HMO or UKBB. For more information go to: https://tanaylab.weizmann.ac.il/labs/
Installation
You can install the development version of labNorm from GitHub using
the remotes package:
retmotes::install_github("tanaylab/labNorm")
Example
Normalize hemoglobin values for a group of subjects:
library(labNorm)

# Add a column for the normalized values
hemoglobin_data$quantile <- ln_normalize(
    hemoglobin_data$value,
    hemoglobin_data$age,
    hemoglobin_data$sex,
    "Hemoglobin"
)
#> → Downloading to a temporary directory '/tmp/RtmpnrSi5j'.
#> → Extracting data to '/tmp/RtmpnrSi5j'.
#> → Extracting data to '/tmp/RtmpnrSi5j'.
#> ✔ Data downloaded successfully.

head(hemoglobin_data)
#>   age    sex value   quantile
#> 1  20   male  9.39 0.01882213
#> 2  20   male 14.03 0.18674720
#> 3  20   male 14.44 0.27947363
#> 4  20   male 15.80 0.75195053
#> 5  20 female 12.06 0.24249167
#> 6  20 female 12.89 0.57451617
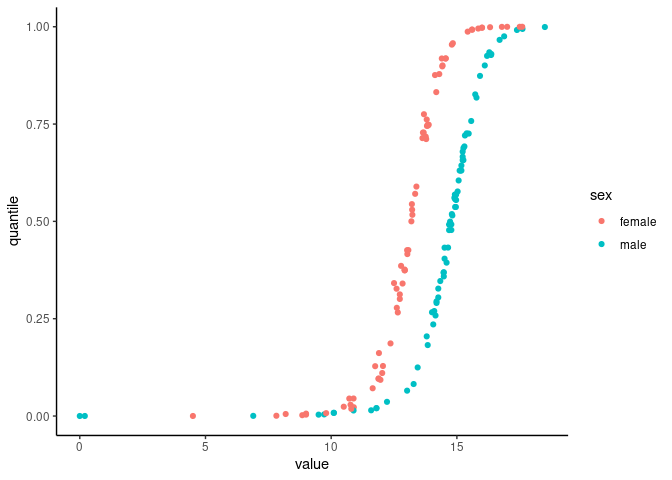
Plot the quantiles vs values for age 50-60:
library(ggplot2)
library(dplyr)
#>
#> Attaching package: 'dplyr'
#> The following objects are masked from 'package:stats':
#>
#>     filter, lag
#> The following objects are masked from 'package:base':
#>
#>     intersect, setdiff, setequal, union

hemoglobin_data %>%
    filter(age >= 50 & age <= 60) %>%
    ggplot(aes(x = value, y = quantile, color = sex)) +
    geom_point() +
    theme_classic()
Plot the age/sex distribution of Hemoglobin:
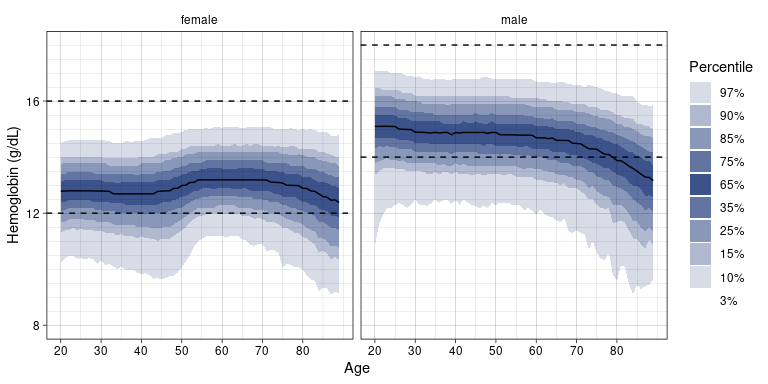
ln_plot_dist("Hemoglobin")