iglu
Interpreting Glucose Data from Continuous Glucose Monitors
Implements a wide range of metrics for measuring glucose control and glucose variability based on continuous glucose monitoring data. The list of implemented metrics is summarized in Rodbard (2009)
iglu



iglu: Interpreting data from Continuous Glucose Monitors (CGMs)
The R package ‘iglu’ provides functions for outputting relevant metrics for data collected from Continuous Glucose Monitors (CGM). For reference, see “Interpretation of continuous glucose monitoring data: glycemic variability and quality of glycemic control.” Rodbard (2009). For more information on the package, see package website.
To cite:
-
Broll S, Urbanek J, Buchanan D, Chun E, Muschelli J, Punjabi N and Gaynanova I (2021). Interpreting blood glucose data with R package iglu. PLoS One, Vol. 16, No. 4, e0248560.
-
Broll S, Buchanan D, Chun E, Muschelli J, Fernandes N, Seo J, Shih J, Urbanek J, Schwenck J, Gaynanova I (2021). iglu: Interpreting Glucose Data from Continuous Glucose Monitors. R package version 3.0.0.
iglu comes with two example datasets: example_data_1_subject and example_data_5_subject. These data are collected using Dexcom G4 CGM on subjects with Type II diabetes. Each dataset follows the structure iglu’s functions are designed around. Note that the 1 subject data is a subset of the 5 subject data. See the examples below for loading and using the data.
Installation
The R package ‘iglu’ is available from CRAN, use the commands below to install the most recent Github version.
# Plain installation
devtools::install_github("irinagain/iglu") # iglu package

# For installation with vignette
devtools::install_github("irinagain/iglu", build_vignettes = TRUE)
Example
library(iglu)
data(example_data_1_subject) # Load single subject data
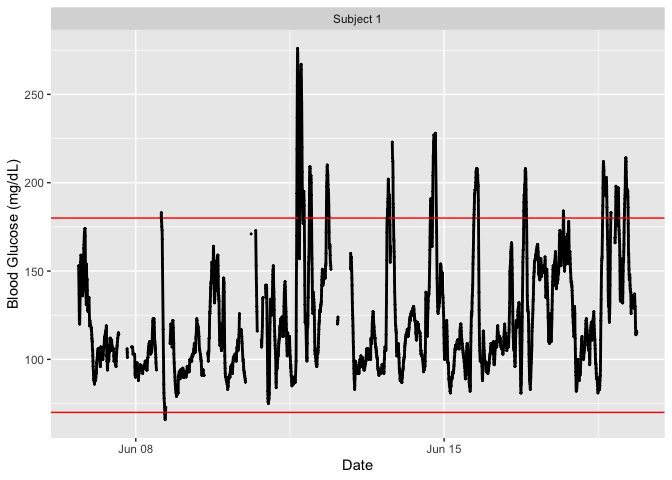
## Plot data

# Use plot on dataframe with time and glucose values for time series plot
plot_glu(example_data_1_subject)
# Summary statistics and some metrics
summary_glu(example_data_1_subject)
#> # A tibble: 1 × 7
#> # Groups:   id [1]
#>   id         Min. `1st Qu.` Median  Mean `3rd Qu.`  Max.
#>   <fct>     <dbl>     <dbl>  <dbl> <dbl>     <dbl> <dbl>
#> 1 Subject 1    66        99    112  124.       143   276

in_range_percent(example_data_1_subject)
#> # A tibble: 1 × 3
#>   id        in_range_63_140 in_range_70_180
#>   <fct>               <dbl>           <dbl>
#> 1 Subject 1            73.9            91.7

above_percent(example_data_1_subject, targets = c(80,140,200,250))
#> # A tibble: 1 × 5
#>   id        above_140 above_200 above_250 above_80
#>   <fct>         <dbl>     <dbl>     <dbl>    <dbl>
#> 1 Subject 1      26.1      3.40     0.377     99.3

j_index(example_data_1_subject)
#> # A tibble: 1 × 2
#>   id        J_index
#>   <fct>       <dbl>
#> 1 Subject 1    24.6

conga(example_data_1_subject)
#> # A tibble: 1 × 2
#>   id        CONGA
#>   <fct>     <dbl>
#> 1 Subject 1  37.0

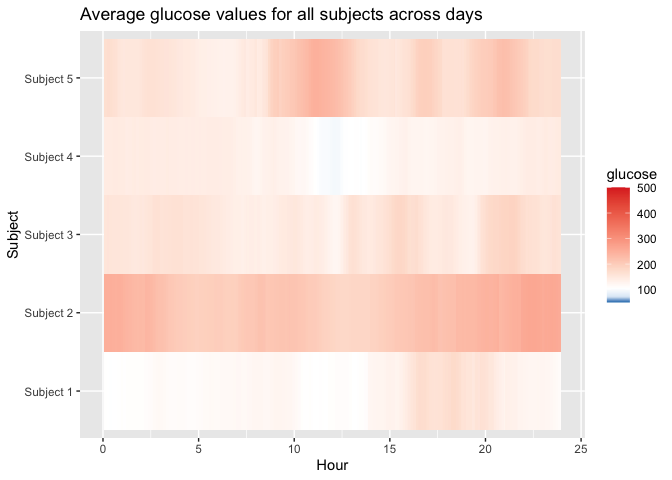
# Load multiple subject data
data(example_data_5_subject)

plot_glu(example_data_5_subject, plottype = 'lasagna', datatype = 'average')
#> Warning: Removed 5 rows containing missing values (`geom_tile()`).
below_percent(example_data_5_subject, targets = c(80,170,260))
#> # A tibble: 5 × 4
#>   id        below_170 below_260 below_80
#>   <fct>         <dbl>     <dbl>    <dbl>
#> 1 Subject 1      89.3      99.7    0.583
#> 2 Subject 2      16.8      78.4    0
#> 3 Subject 3      72.7      95.9    0.848
#> 4 Subject 4      91.0     100      1.69
#> 5 Subject 5      54.6      90.1    1.03

mage(example_data_5_subject)
#> Gap found in data for subject id: Subject 2, that exceeds 12 hours.
#> # A tibble: 5 × 2
#> # Rowwise:
#>   id         MAGE
#>   <fct>     <dbl>
#> 1 Subject 1  87.2
#> 2 Subject 2 111.
#> 3 Subject 3 115.
#> 4 Subject 4  70.1
#> 5 Subject 5 146.
Shiny App
Shiny App can be accessed locally via
library(iglu)
iglu_shiny()
or globally at https://irinagain.shinyapps.io/shiny_iglu/. As new functionality gets added, local version will be slightly ahead of the global one.