ggparty
'ggplot' Visualizations for the 'partykit' Package
Extends 'ggplot2' functionality to the 'partykit' package. 'ggparty' provides the necessary tools to create clearly structured and highly customizable visualizations for tree-objects of the class 'party'.
ggparty
ggplot2 visualizations for the partykit package.
Install
devtools::install_github("martin-borkovec/ggparty",
                         dependencies = TRUE)
Example
library(ggparty)

data("TeachingRatings", package = "AER")
tr <- subset(TeachingRatings, credits == "more")

tr_tree <- lmtree(eval ~ beauty | minority + age + gender + division + native +
                    tenure, data = tr, weights = students, caseweights = FALSE)

ggparty(tr_tree,
        terminal_space = 0.5,
        add_vars = list(p.value = "$node$info$p.value")) +
  geom_edge(size = 1.5) +
  geom_edge_label(colour = "grey", size = 6) +
  geom_node_plot(gglist = list(geom_point(aes(x = beauty,
                                             y = eval,
                                             col = tenure,
                                             shape = minority),
                                         alpha = 0.8),
                              theme_bw(base_size = 15)),
                scales = "fixed",
                id = "terminal",
                shared_axis_labels = T,
                shared_legend = T,
                legend_separator = T,
                predict = "beauty",
                predict_gpar = list(col = "blue",
                                   size = 1.2)
                ) +
  geom_node_label(aes(col = splitvar),
                  line_list = list(aes(label = paste("Node", id)),
                                   aes(label = splitvar),
                                   aes(label = paste("p =", formatC(p.value, format = "e", digits = 2)))),
                  line_gpar = list(list(size = 12, col = "black", fontface = "bold"),
                                   list(size = 20),
                                   list(size = 12)),
                  ids = "inner") +
  geom_node_label(aes(label = paste0("Node ", id, ", N = ", nodesize)),
                  fontface = "bold",
                  ids = "terminal",
                  size = 5,
                  nudge_y = 0.01) +
  theme(legend.position = "none")
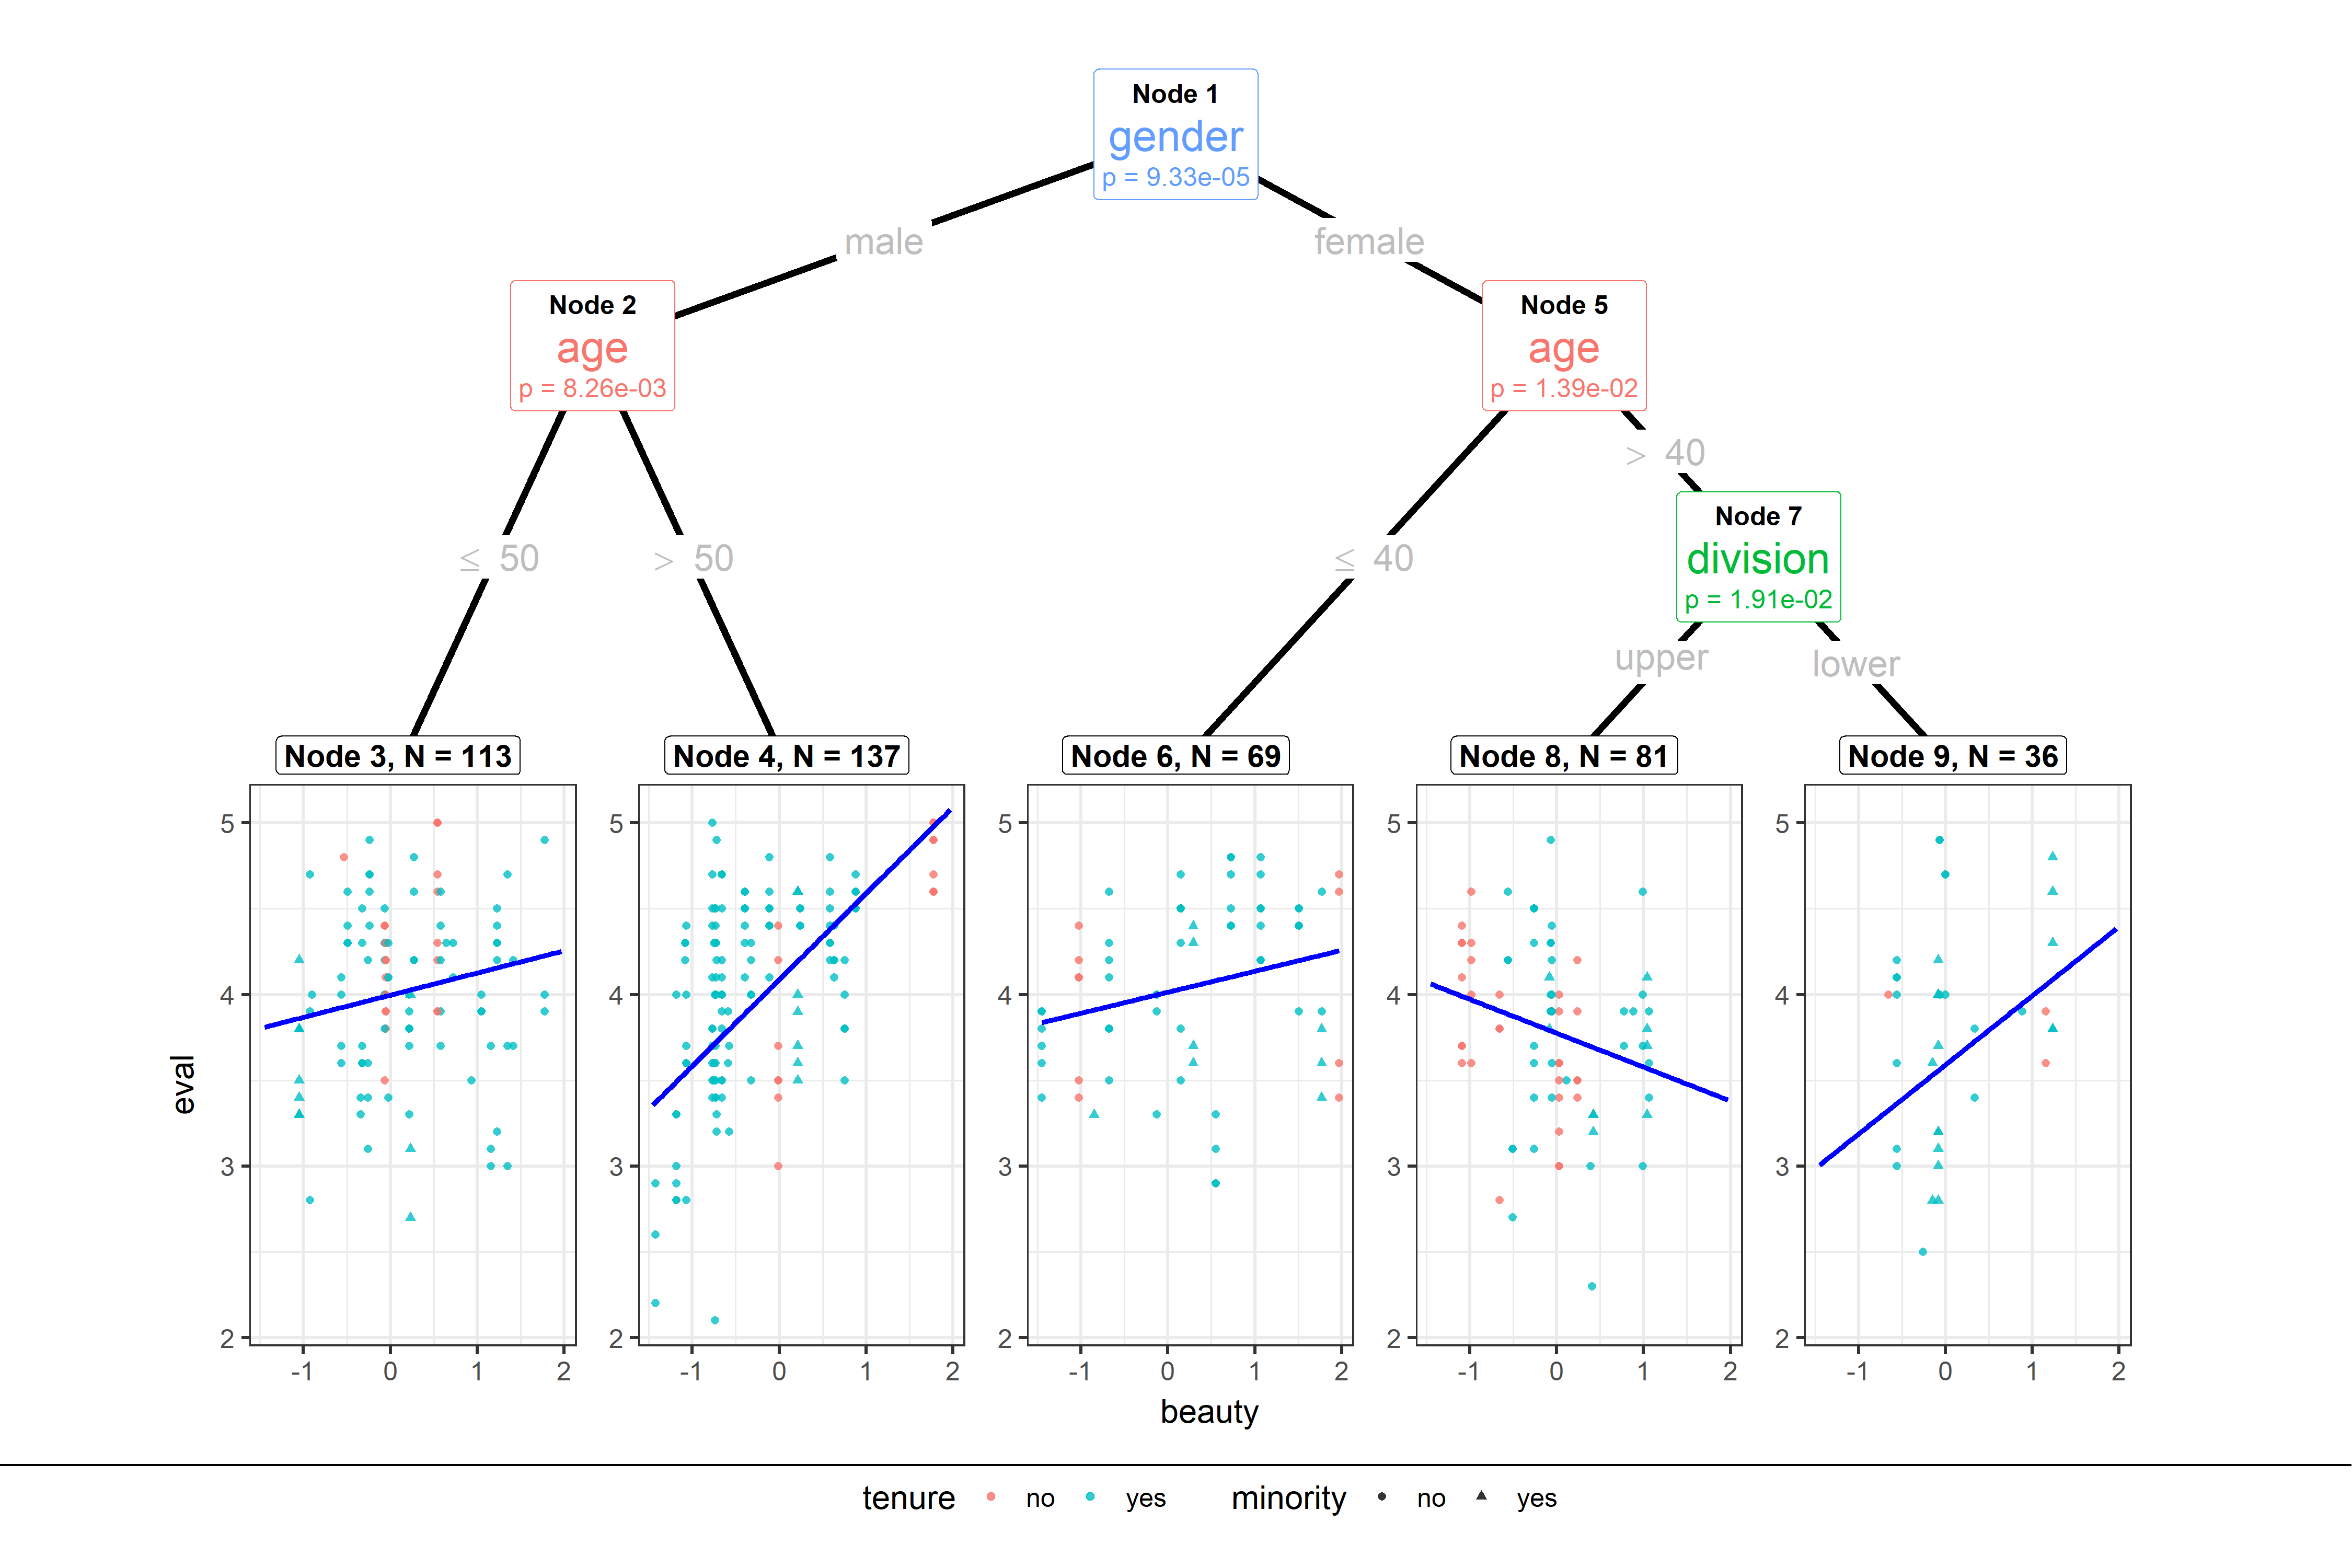
How to Use
ggparty tries to stick as closely as possible to ggplot2’s grammar of graphics. The basic building blocks to a ggparty plot are:
-
ggparty() replaces the usual
ggplot(). Takes a object of class'party'instead of a'data.frame'. -
geom_edge() draws the edges between the nodes
-
geom_edge_label() labels the edges with the corresponding split breaks
-
geom_node_label() labels the nodes with the split variable, node info or anything else. The shorthand versions of this geom geom_node_splitvar() and geom_node_info() have the correct defaults to write the split variables in the inner nodes resp. the info in the terminal nodes.
-
geom_node_plot() creates a custom ggplot at the location of the node
Make sure to check out the wiki or the vignettes for detailed information on the usage of ggparty.
If you find any bugs or have any suggestions or questions feel free to contact me or post an issue! Thanks for your support!
