ggblanket
Publication-Quality 'ggplot2' Visualisation
Wrapper 'ggplot2' functions for publication-quality visualisation. Aligned with 'ggplot2' and 'tidyverse'. Covers much of what 'ggplot2' does.
ggblanket 
Objective
ggblanket is a package of ggplot2 wrapper functions for publication-quality visualisation. It seeks to support well-designed visualisation, while aligning as much as possible with ggplot2 and tidyverse conventions.
Installation
Install from CRAN, or development version from GitHub.
install.packages("ggblanket")
pak::pak("davidhodge931/ggblanket")
Example
library(ggblanket)
library(ggplot2)
library(dplyr)

set_blanket()

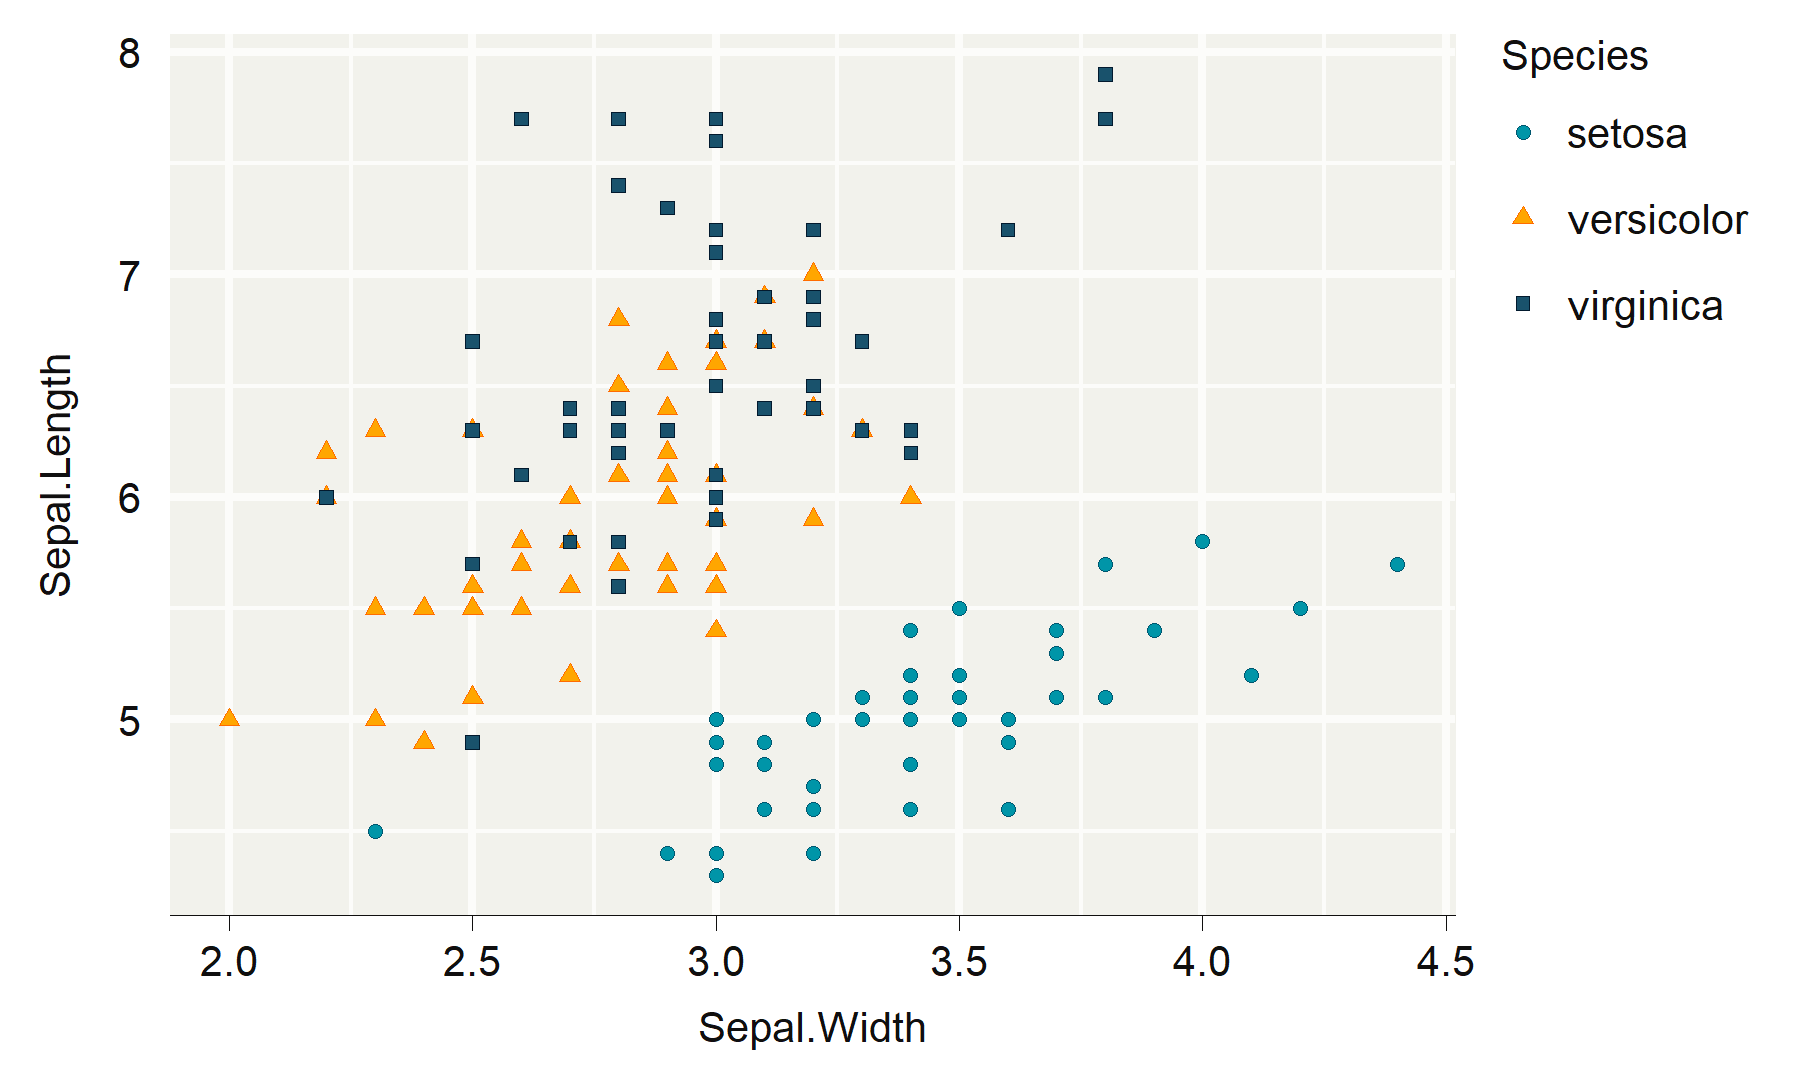
iris |>
  gg_point(
    x = Sepal.Width,
    y = Sepal.Length,
    fill = Species,
    shape = Species,
  )
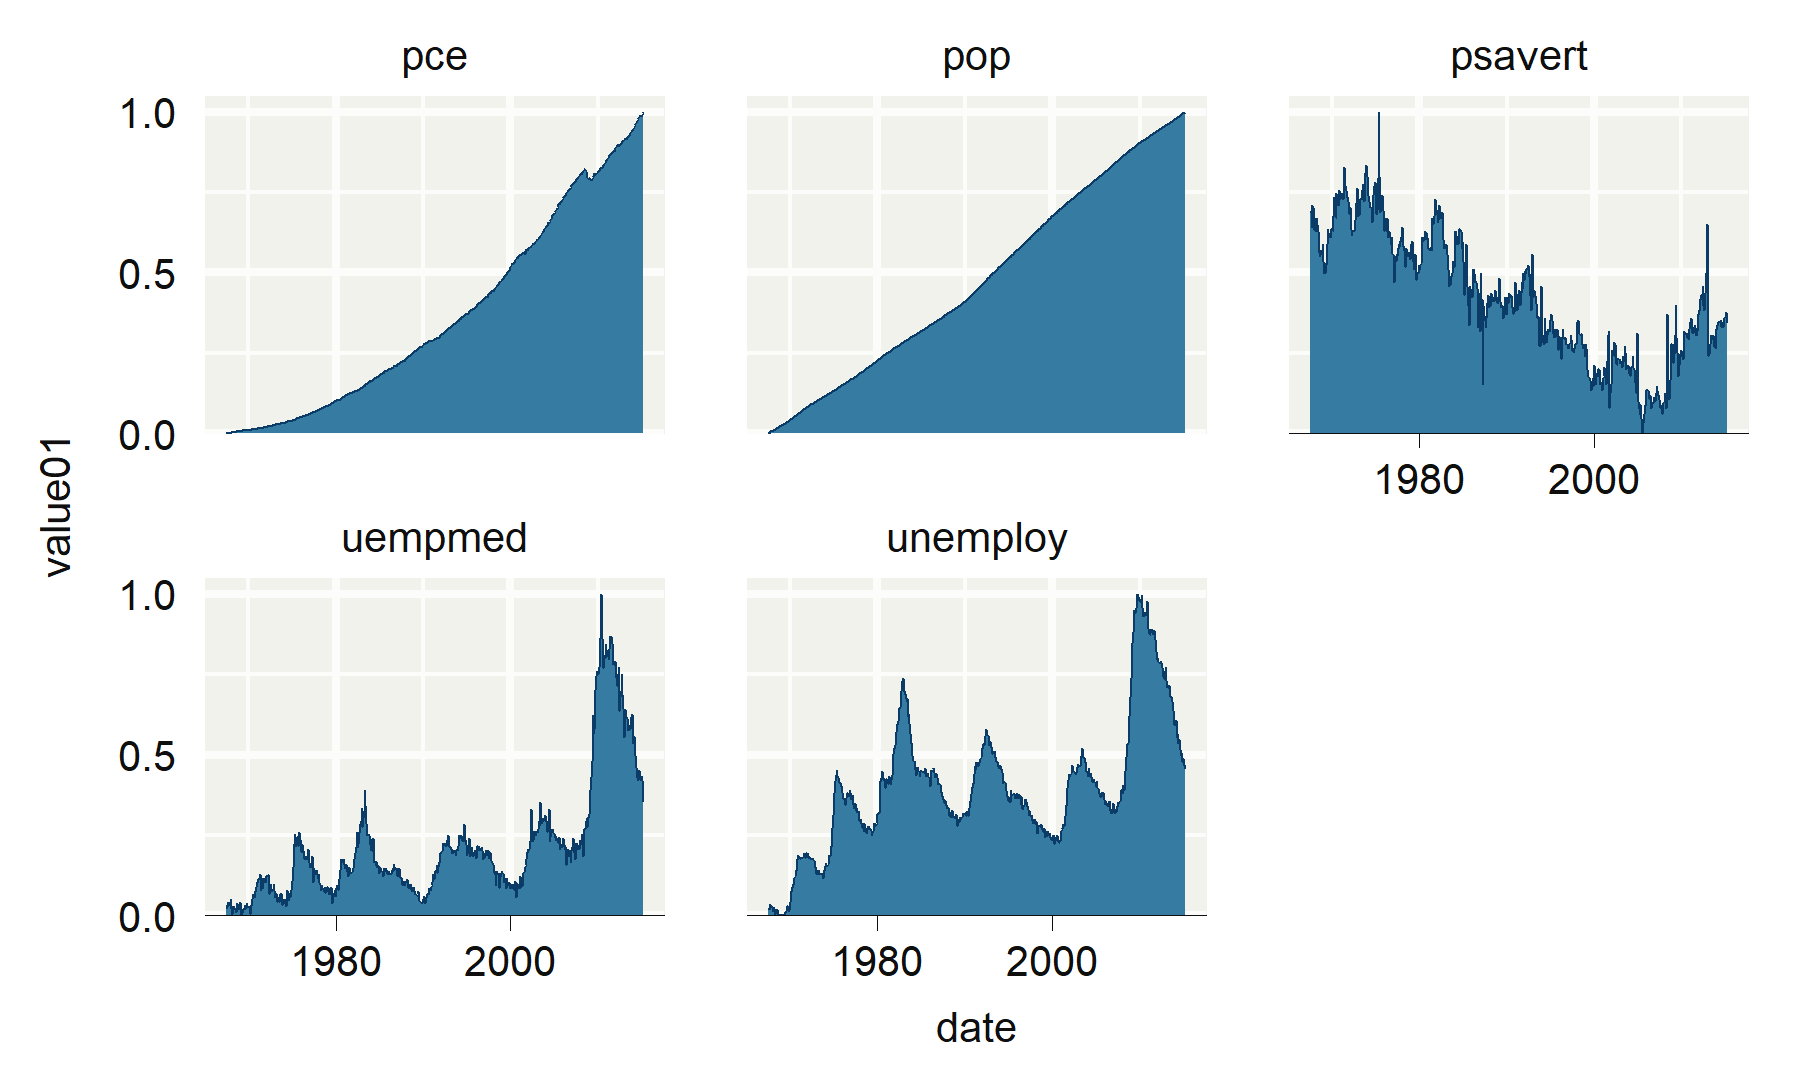
ggplot2::economics_long |>
  gg_area(
    x = date,
    y = value01,
    facet_wrap = variable,
  )
How it works
Use the gg_*() wrapper functions to:
- Plot a ggplot and geom layer in a single function
- Map aesthetic and facet variables as bare names
- Get
colourandcolour_*arguments inherited fromfillandfill_*arguments - Change scale arguments easily with prefixed arguments
- If lower x/y scale limit is zero, get default scale expansion of
ggplot2::expansion(c(0, 0.5)) - Access to other arguments within relevant
geom_*function via... - Get global
set_blanket()setting defaults.
Use the global setup function, set_blanket(), to:
- Adjust the global theme
- Adjust the global option for how themes are to be refined based on plot scale types etc
- Adjust the global theme
fill,colour,linewidth,shape,linetype,size,stroke - Adjust the global theme
fill_palette,colour_palette,shape_paletteandlinetype_palette - Adjust the global option for
colour_border, which is a function to transform thecolourandcolour_palettewith input of thefillandfill_paletterespectively - Adjust the global option for
fill_border, which is a function to transform thefillandfill_palettewith input of thecolourandcolour_paletterespectively
Other packages
This package is part of a group of related packages built to extend ggplot2.
|
|
|
|
|
|
|


