geofi
Access Finnish Geospatial Data
Designed to simplify geospatial data access from the Statistics Finland Web Feature Service API < https://geo.stat.fi/geoserver/index.html>, the geofi package offers researchers and analysts a set of tools to obtain and harmonize administrative spatial data for a wide range of applications, from urban planning to environmental research. The package contains annually updated time series of municipality key datasets that can be used for data aggregation and language translations.






geofi - Access Finnish Geospatial Data 
Access Finnish Geospatial Data.
Installation and use
# install from CRAN
install.packages("geofi")

# Install development version from GitHub
remotes::install_github("ropengov/geofi")
With geofi-package you can download geospatial data on municipalities,
zipcodes and population and statistical grids from Statistics Finland
WFS-api.
In addition, you have on-board municipality keys for aggregating
municipality-level data into higher level regional distributions based
Statistics Finland classification
API.
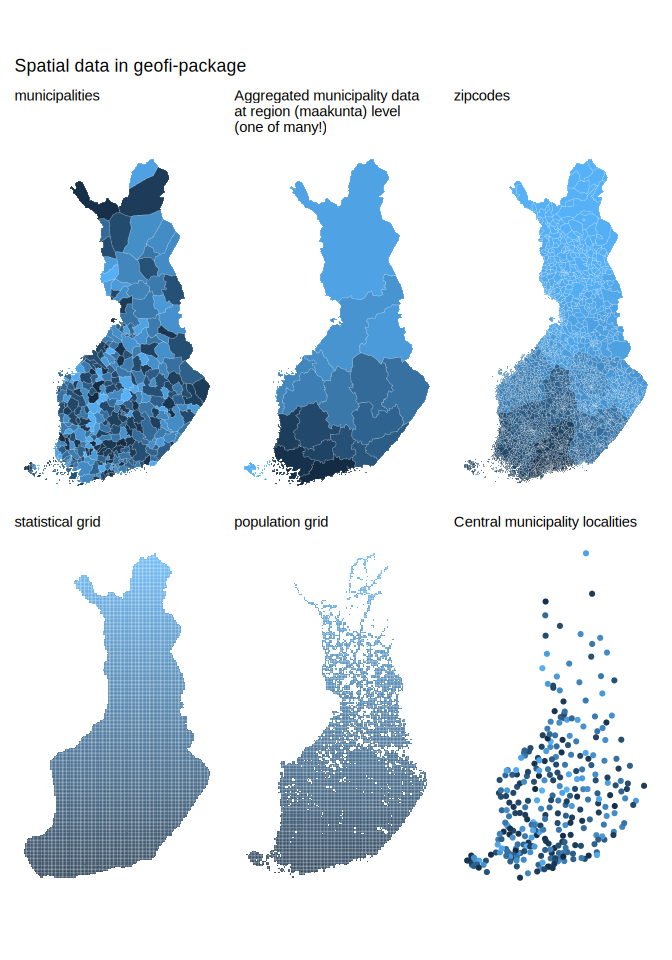
Below are few examples of the data you can access using geofi. Please
have a closer look at the
vignettes for
more comprehensive use cases.
library(geofi)
d1 <- get_municipalities(year = 2025)
d2 <- get_zipcodes(year = 2025)
d3 <- get_statistical_grid(resolution = 5)
d4 <- get_population_grid(resolution = 5)
d5 <- municipality_central_localities()

library(ggplot2)
library(dplyr)
theme_set(
  theme_minimal(base_family = "Arial") +
  theme(legend.position= "none",
        axis.text = element_blank(),
        axis.title = element_blank(),
        panel.grid = element_blank()
        )
)
p1 <- ggplot(d1, aes(fill = kunta)) + geom_sf(colour = alpha("white", 1/3)) + labs(subtitle = "municipalities")
p2 <- ggplot(d1 |> count(maakunta_code), aes(fill = maakunta_code)) + geom_sf(colour = alpha("white", 1/3)) + labs(subtitle = "Aggregated municipality data \nat region (maakunta) level \n(one of many!)")
p3 <- ggplot(d2, aes(fill = as.integer(posti_alue))) + geom_sf(colour = alpha("white", 1/3)) + labs(subtitle = "zipcodes")
p4 <- ggplot(d3, aes(fill = nro)) + geom_sf(colour = alpha("white", 1/3)) + labs(subtitle = "statistical grid")
p5 <- ggplot(d4, aes(fill = id_nro)) + geom_sf(colour = alpha("white", 1/3)) + labs(subtitle = "population grid")
p6 <- ggplot(d5, aes(color = as.integer(kuntatunnus))) + geom_sf() + labs(subtitle = "Central municipality localities")

library(patchwork)
wrap_plots(list(p1,p2,p3,p4,p5,p6), ncol = 3) +
  patchwork::plot_annotation(title = "Spatial data in geofi-package")
Contribute
Contributions are very welcome:
- Use issue tracker for feedback and bug reports.
- Send pull requests
- Star us on the Github page
Acknowledgements
Kindly cite this work as follows:
citation("geofi")
Kindly cite the geofi R package as follows:

To cite 'geofi' in publications use:

  Kainu M, Lehtomaki J, Parkkinen J, Miettinen J, Kantanen P, Vesanen
  S, Lahti L (2026). _geofi: Access Finnish Geospatial Data_.
  doi:10.32614/CRAN.package.geofi
  <https://doi.org/10.32614/CRAN.package.geofi>, R package version
  1.2.0, <https://github.com/rOpenGov/geofi>.

A BibTeX entry for LaTeX users is

  @Manual{R-geofi,
    title = {{geofi: Access Finnish Geospatial Data}},
    doi = {10.32614/CRAN.package.geofi},
    author = {Markus Kainu and Joona Lehtomaki and Juuso Parkkinen and Jani Miettinen and Pyry Kantanen and Sampo Vesanen and Leo Lahti},
    year = {2026},
    version = {1.2.0},
    note = {R package version 1.2.0},
    url = {https://github.com/rOpenGov/geofi},
  }

Many thanks for all contributors! For more info, see:
https://github.com/rOpenGov/geofi
We are grateful to all contributors. This project is part of rOpenGov.