AutoEDA
Automatic Exploratory Data Analysis
Automatically performs exploratory data analysis for tabular datasets, including data summaries, missing value analysis, descriptive statistics, visualizations, correlation analysis, outlier detection, and automated report generation. The package provides a streamlined workflow for rapid data exploration and produces publication-ready tables and graphics. For methodological details, see Tukey (1977, ISBN:9780201076165) and the cited methodological literature in the package documentation.
AutoEDA

Overview
AutoEDA is an R package for performing comprehensive Automatic Exploratory Data Analysis (EDA) with minimal code.
The package generates descriptive statistics, missing value summaries, visualizations, correlation analysis, outlier detection, principal component analysis (PCA), clustering, and automated reports.
Features
- Dataset summary
- Missing value analysis
- Numeric summary statistics
- Categorical variable summary
- Correlation analysis
- Automatic visualizations
- Outlier detection
- Principal Component Analysis (PCA)
- Cluster analysis
- Excel report generation
- Publication-quality graphics
Installation
Install the development version from GitHub.
# install.packages("remotes")

remotes::install_github("vinodhpmd/AutoEDA")
Quick Start
library(AutoEDA)

report <- auto_eda(iris)

report
#>
#> ========================================
#>         AutoEDA Report
#> ========================================
#>
#> Modules Completed
#>
#> * Summary
#> * Missing
#> * Numeric
#> * Categorical
#> * Correlation
#> * Outliers
#> * PCA
#> * Cluster
Dataset Summary
summary_data(iris)
#> $Rows
#> [1] 150
#>
#> $Columns
#> [1] 5
#>
#> $NumericVariables
#> [1] 4
#>
#> $CharacterVariables
#> [1] 0
#>
#> $FactorVariables
#> [1] 1
#>
#> $LogicalVariables
#> [1] 0
#>
#> $MissingValues
#> [1] 0
#>
#> $DuplicateRows
#> [1] 1
#>
#> $MemoryMB
#> [1] 0.01
#>
#> attr(,"class")
#> [1] "SummaryData"
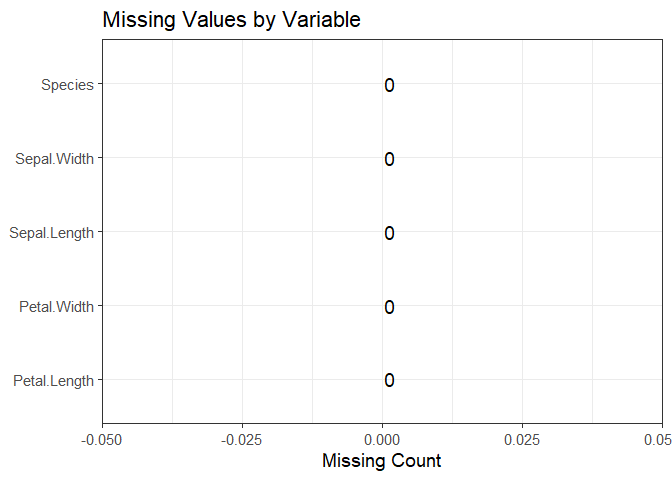
Missing Value Analysis
missing_summary(iris)
#>
#> =========================================
#>       AutoEDA Missing Value Report
#> =========================================
#>
#> Rows                         150
#> Columns                      5
#> Variables with Missing       0
#> Complete Cases               150
#> Total Missing Values         0
#> Overall Missing              0.00%
#>
#> Variable Summary
#> -----------------------------------------
#>      Variable    Type Missing Percent Complete
#>  Sepal.Length numeric       0       0      150
#>   Sepal.Width numeric       0       0      150
#>  Petal.Length numeric       0       0      150
#>   Petal.Width numeric       0       0      150
#>       Species  factor       0       0      150
Numeric Summary
numeric_summary(iris)
#>
#> =========================================
#>      AutoEDA Numeric Summary
#> =========================================
#>
#>      Variable   N Missing Mean Median    SD Variance     SE   CV Minimum  Q1
#>  Sepal.Length 150       0 5.84   5.80 0.828    0.686 0.0676 14.2     4.3 5.1
#>   Sepal.Width 150       0 3.06   3.00 0.436    0.190 0.0356 14.3     2.0 2.8
#>  Petal.Length 150       0 3.76   4.35 1.765    3.116 0.1441 47.0     1.0 1.6
#>   Petal.Width 150       0 1.20   1.30 0.762    0.581 0.0622 63.6     0.1 0.3
#>   Q3 Maximum IQR Range Skewness Kurtosis Shapiro_P
#>  6.4     7.9 1.3   3.6    0.309   -0.606  1.02e-02
#>  3.3     4.4 0.5   2.4    0.313    0.139  1.01e-01
#>  5.1     6.9 3.5   5.9   -0.269   -1.417  7.41e-10
#>  1.8     2.5 1.5   2.4   -0.101   -1.358  1.68e-08
Correlation Analysis
correlation_analysis(iris)
#>
#> =====================================
#>       Correlation Matrix
#> =====================================
#>
#>              Sepal.Length Sepal.Width Petal.Length Petal.Width
#> Sepal.Length        1.000      -0.118        0.872       0.818
#> Sepal.Width        -0.118       1.000       -0.428      -0.366
#> Petal.Length        0.872      -0.428        1.000       0.963
#> Petal.Width         0.818      -0.366        0.963       1.000
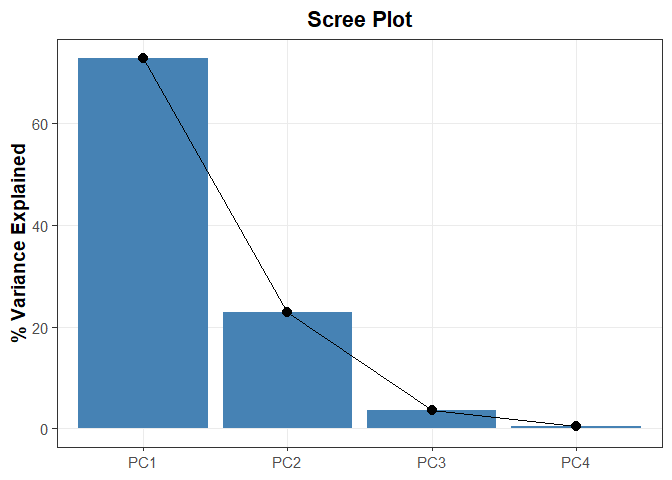
Principal Component Analysis
pca <- pca_analysis(iris)

pca
#>
#> ==============================
#>  Principal Component Analysis
#> ==============================
#>
#>          Length Class  Mode
#> sdev       4    -none- numeric
#> rotation  16    -none- numeric
#> center     4    -none- numeric
#> scale      4    -none- numeric
#> x        600    -none- numeric
Cluster Analysis
cluster_analysis(iris)
#>
#> ===================================
#>       Cluster Analysis
#> ===================================
#>
#> Clusters : 3
#>
#> Cluster Sizes
#> [1] 53 47 50
Generate Complete Report
report <- auto_eda(iris)

report
#>
#> ========================================
#>         AutoEDA Report
#> ========================================
#>
#> Modules Completed
#>
#> * Summary
#> * Missing
#> * Numeric
#> * Categorical
#> * Correlation
#> * Outliers
#> * PCA
#> * Cluster
Package Structure
AutoEDA
│
├── Data Summary
├── Missing Value Analysis
├── Numeric Summary
├── Categorical Summary
├── Correlation Analysis
├── Outlier Detection
├── PCA
├── Cluster Analysis
├── Automatic Plots
└── Report Generation
Author
Vinodhkumar
License
MIT License