tna
Transition Network Analysis (TNA)
Provides tools for performing Transition Network Analysis (TNA) to
study relational dynamics, including functions for building and plotting TNA
models, calculating centrality measures, and identifying dominant events and
patterns. TNA statistical techniques (e.g., bootstrapping and permutation
tests) ensure the reliability of observed insights and confirm that
identified dynamics are meaningful. See (Saqr et al., 2025)
tna: An R package for Transition Network Analysis 




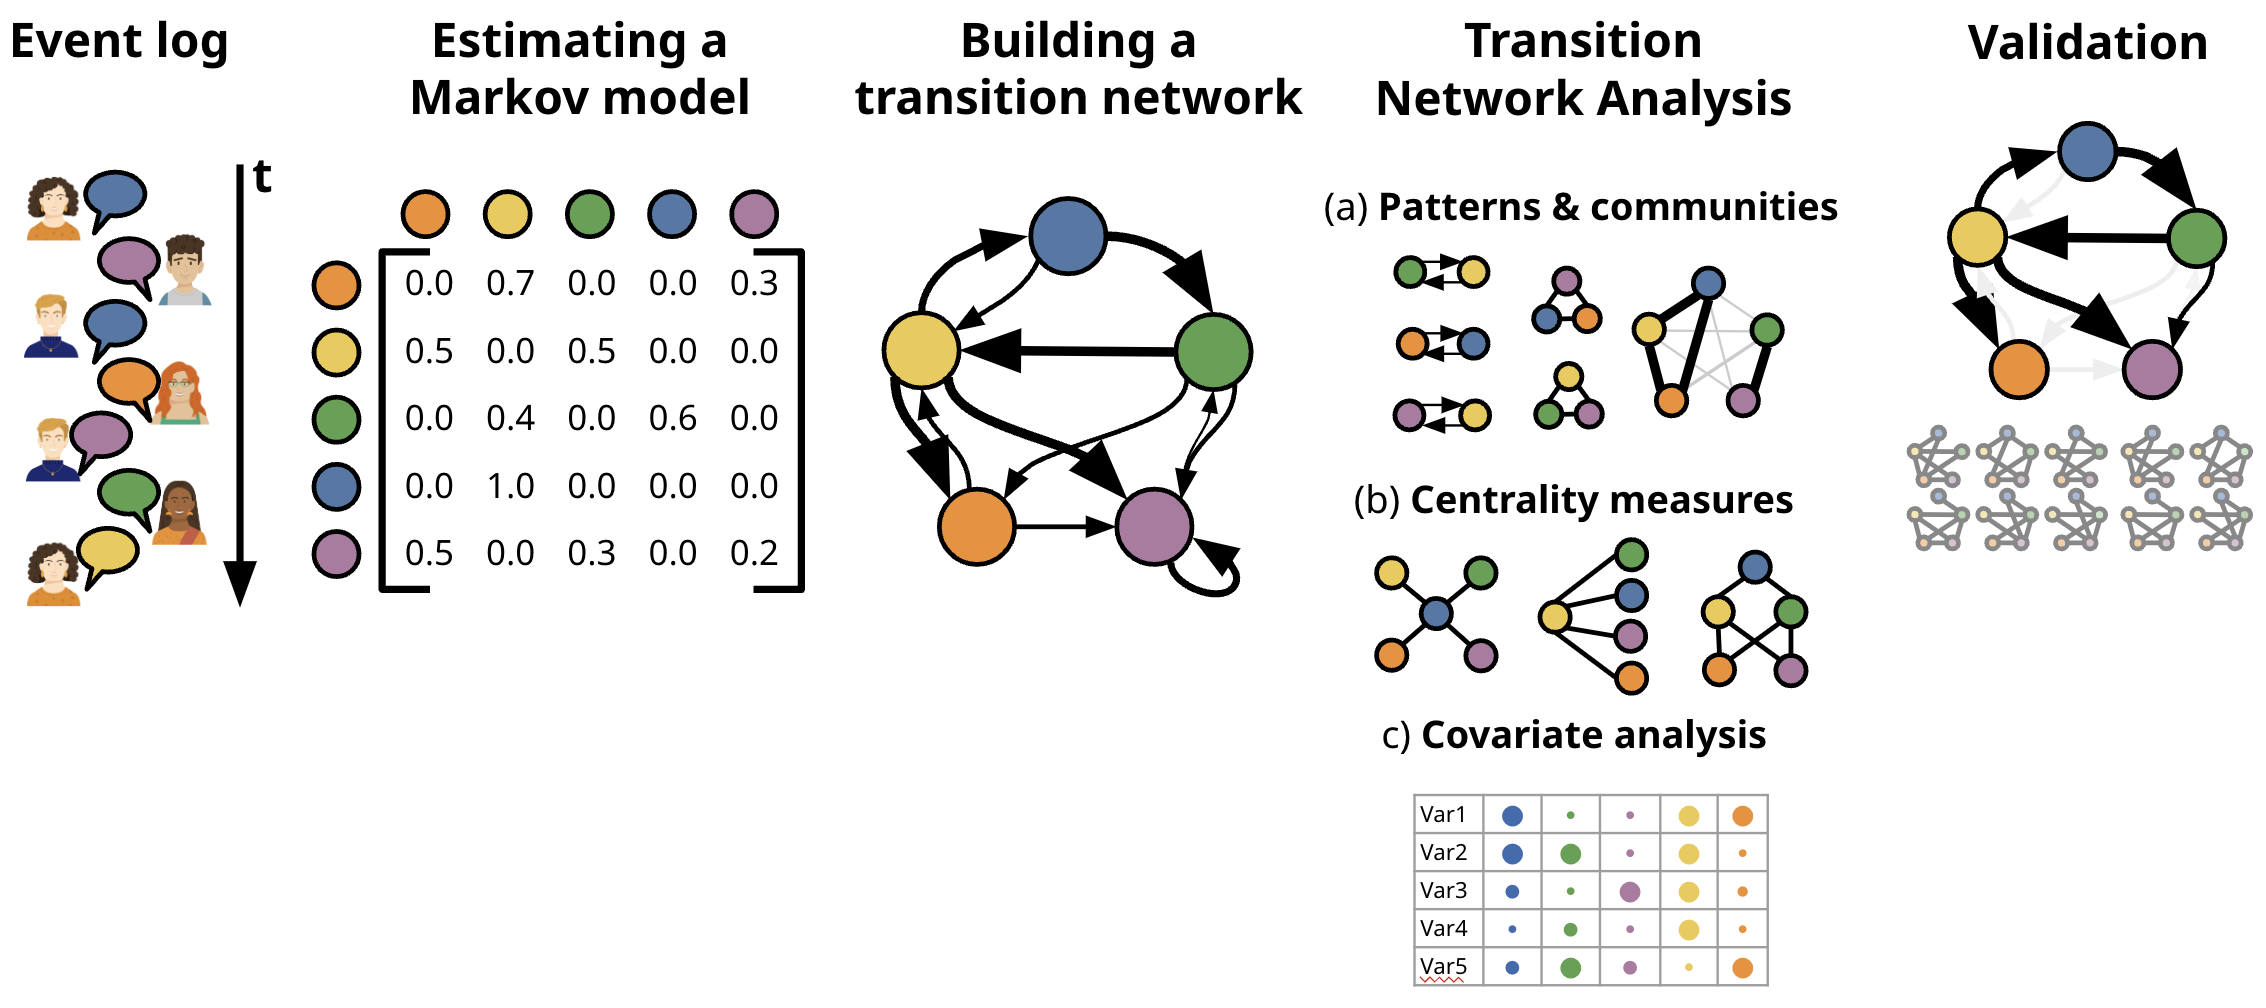
tna is an R package for the analysis of relational dynamics through
Transition Network Analysis (TNA). TNA provides tools for building TNA
models, plotting transition networks, calculating centrality measures,
and identifying dominant events and patterns. TNA statistical techniques
(e.g., bootstrapping and permutation tests) ensure the reliability of
observed insights and confirm that identified dynamics are meaningful.
See (Saqr et al., 2025) for
more details on TNA.
Resources
Companion tutorials
We have also released comprehensive new tutorials for the main TNA features:
| Tutorial | Link |
|---|---|
| An Updated Comprehensive Tutorial on Transition Network Analysis (TNA) | https://sonsoles.me/posts/tna-tutorial/ |
TNA Data Preparation: A Comprehensive Guide to prepare_data() |
https://sonsoles.me/posts/tna-data/ |
| TNA Group Analysis: Analysis and Comparison of Groups | https://sonsoles.me/posts/tna-group/ |
| TNA Clustering: Discovering and Analysis of Clusters | https://sonsoles.me/posts/tna-clustering/ |
| TNA Model Comparison:TNA Model Comparison: A Comprehensive Guide to Network Comparison | https://sonsoles.me/posts/tna-compare/ |
Full reference guide on tna functions |
https://sonsoles.me/tna/tna.html |
Sequence Patterns, Outcomes, and Indices with codyna |
https://sonsoles.me/posts/codyna-seq-tutorial/ |
Vignettes
Check out the tna R package vignettes:
| Vignette | Link |
|---|---|
| Getting started with tna | https://sonsoles.me/tna/articles/tna.html |
| A showcase of the main tna functions | https://sonsoles.me/tna/articles/complete_tutorial.html |
| How to prepare data for tna | https://sonsoles.me/tna/articles/prepare_data.html |
| Frequency-based TNA | https://sonsoles.me/tna/articles/ftna.html |
| Attention TNA | https://sonsoles.me/tna/articles/atna.html |
| Finding cliques and communities | https://sonsoles.me/tna/articles/communities_and_cliques.html |
| Using grouped sequence data | https://sonsoles.me/tna/articles/grouped_sequences.html |
Book chapters
Do not forget to check out our tutorials in the “Advanced learning analytics methods” book:
| Title | Pages | Tutorial |
|---|---|---|
| Saqr, M., Lopez-Pernas, S., & Tikka, S. Mapping Relational Dynamics with Transition Network Analysis: A Primer and Tutorial | https://doi.org/10.1007/978-3-031-95365-1_15 | Online tutorial |
| Saqr, M., Lopez-Pernas, S., & Tikka, S. Capturing the Breadth and Dynamics of the Temporal Processes with Frequency Transition Network Analysis: A Primer and Tutorial | https://doi.org/10.1007/978-3-031-95365-1_16 | Online tutorial |
| Lopez-Pernas, S., Tikka, S., & Saqr, M. Mining Patterns and Clusters with Transition Network Analysis: A Heterogeneity Approach | https://doi.org/10.1007/978-3-031-95365-1_17 | Online tutorial |
Other tools
In addition to the tna R package, you can also try our Shiny
app and Jamovi
plugin.
Installation
You can install the most recent stable version of tna from
CRAN or the development
version from GitHub by running one of the
following:
install.packages("tna")

# install.packages("devtools")
# devtools::install_github("sonsoleslp/tna")
Example
Load the package
library("tna")
Example data
data("group_regulation", package = "tna")
Build a Markov model
tna_model <- tna(group_regulation)
summary(tna_model)
| metric | value |
|---|---|
| Node Count | 9.00 |
| Edge Count | 78.00 |
| Network Density | 1.00 |
| Mean Distance | 0.05 |
| Mean Out-Strength | 1.00 |
| SD Out-Strength | 0.81 |
| Mean In-Strength | 1.00 |
| SD In-Strength | 0.00 |
| Mean Out-Degree | 8.67 |
| SD Out-Degree | 0.71 |
| Centralization (Out-Degree) | 0.02 |
| Centralization (In-Degree) | 0.02 |
| Reciprocity | 0.99 |
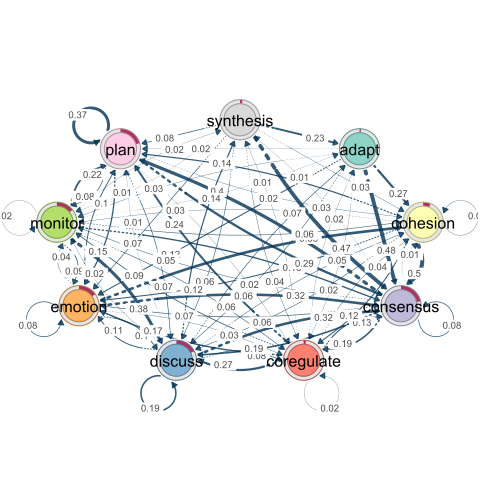
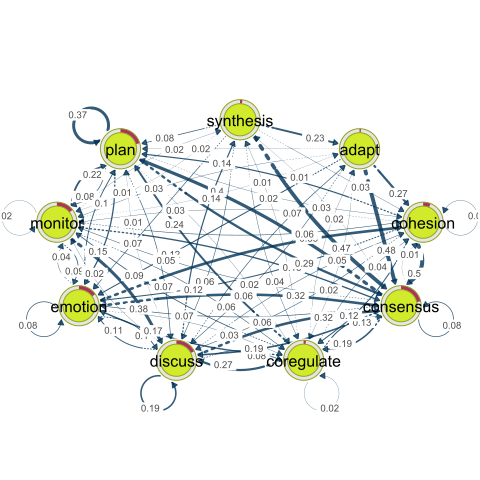
Plot the transition network
plot(tna_model)
 Calculate the centrality measures
cent <- centralities(tna_model)
| state | OutStrength | InStrength | ClosenessIn | ClosenessOut | Closeness | Betweenness | BetweennessRSP | Diffusion | Clustering |
|---|---|---|---|---|---|---|---|---|---|
| adapt | 1.000 | 0.345 | 0.008 | 0.015 | 0.025 | 1.000 | 1.000 | 5.586 | 0.337 |
| cohesion | 0.973 | 0.812 | 0.014 | 0.012 | 0.027 | 0.000 | 19.000 | 5.209 | 0.300 |
| consensus | 0.918 | 2.667 | 0.035 | 0.013 | 0.038 | 30.000 | 103.000 | 4.660 | 0.161 |
| coregulate | 0.977 | 0.567 | 0.016 | 0.015 | 0.021 | 0.000 | 27.000 | 5.148 | 0.306 |
| discuss | 0.805 | 1.188 | 0.020 | 0.013 | 0.027 | 16.000 | 53.000 | 4.628 | 0.240 |
| emotion | 0.923 | 0.894 | 0.014 | 0.012 | 0.023 | 5.000 | 36.000 | 5.070 | 0.290 |
| monitor | 0.982 | 0.346 | 0.008 | 0.014 | 0.019 | 0.000 | 11.000 | 5.157 | 0.289 |
| plan | 0.626 | 1.194 | 0.027 | 0.012 | 0.027 | 9.000 | 61.000 | 3.488 | 0.287 |
| synthesis | 1.000 | 0.192 | 0.010 | 0.016 | 0.024 | 7.000 | 3.000 | 5.583 | 0.359 |
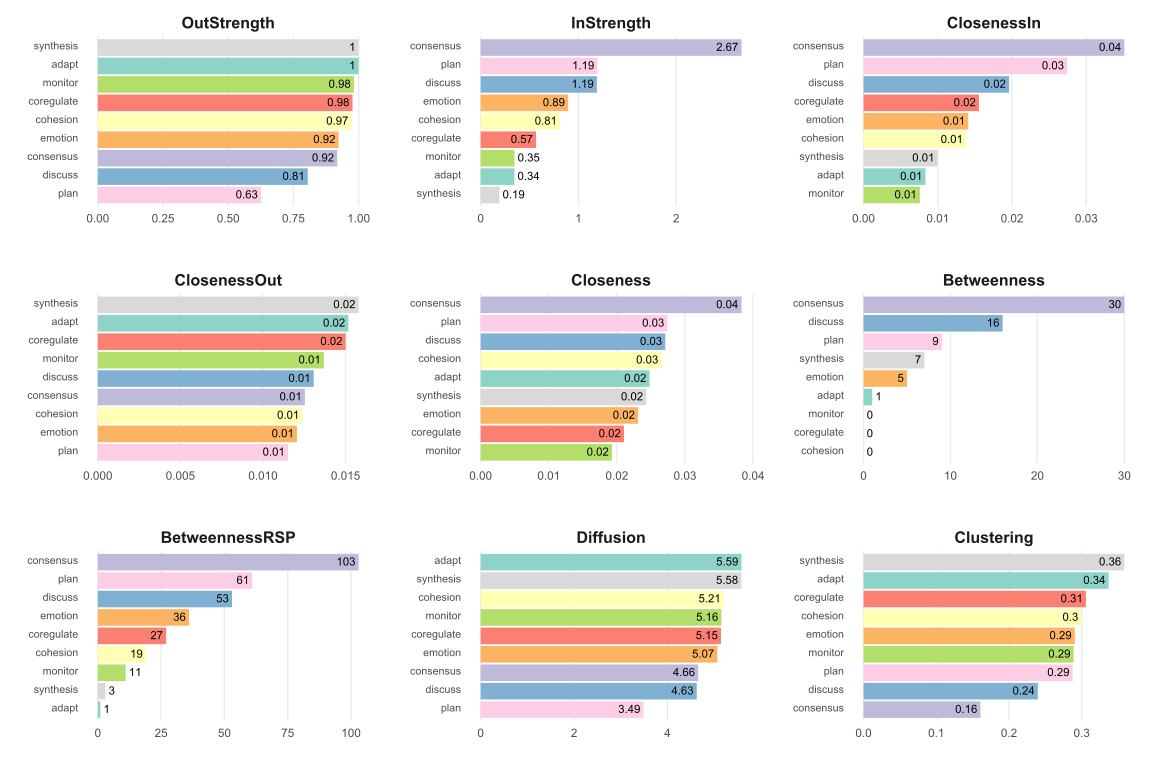
Plot the centrality measures
plot(cent, ncol = 3)
Estimate centrality stability
estimate_centrality_stability(tna_model)
#> Centrality Stability Coefficients
#>
#>  InStrength OutStrength Betweenness
#>         0.9         0.9         0.9
Identify and plot communities
coms <- communities(tna_model)
plot(coms)
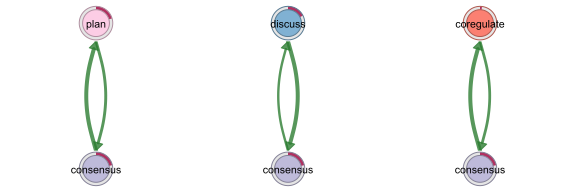
Find and plot cliques
cqs <- cliques(tna_model, threshold = 0.12)
plot(cqs)
Compare high achievers (first 1000) with low achievers (last 1000)
tna_model_start_high <- tna(group_regulation[1:1000, ])
tna_model_start_low <- tna(group_regulation[1001:2000, ])
comparison <- permutation_test(
  tna_model_start_high,
  tna_model_start_low,
  measures = c("InStrength")
)
Simple comparison vs. permutation test comparison
plot_compare(tna_model_start_high, tna_model_start_low)
plot(comparison)
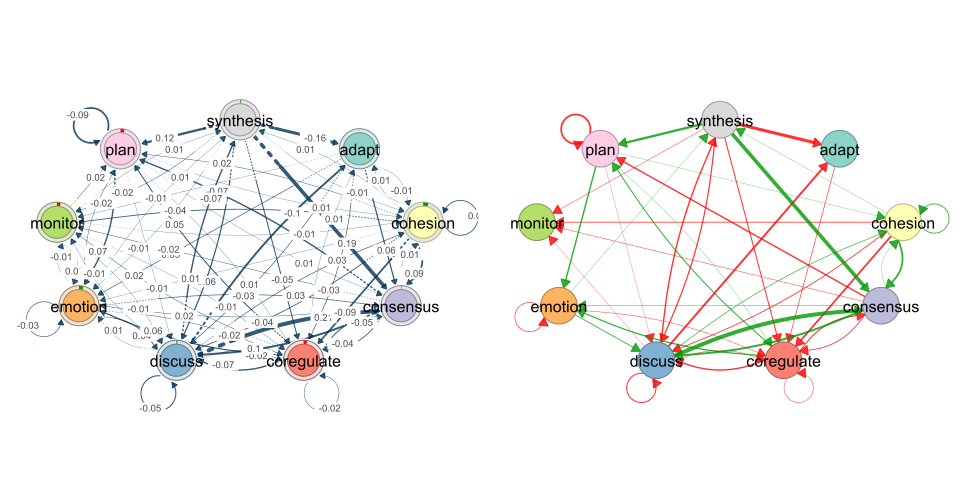
Compare centralities
print(comparison$centralities$stats)
| state | centrality | diff_true | effect_size | p_value |
|---|---|---|---|---|
| adapt | InStrength | -0.23693341 | -6.5741846 | 0.000999001 |
| cohesion | InStrength | 0.01634987 | 0.3369021 | 0.743256743 |
| consensus | InStrength | 0.53680793 | 7.7240021 | 0.000999001 |
| coregulate | InStrength | -0.25275371 | -7.3308543 | 0.000999001 |
| discuss | InStrength | -0.09009651 | -1.9372656 | 0.046953047 |
| emotion | InStrength | 0.19288376 | 4.0496273 | 0.000999001 |
| monitor | InStrength | -0.09192991 | -3.5069394 | 0.000999001 |
| plan | InStrength | 0.12225988 | 2.7153863 | 0.005994006 |
| synthesis | InStrength | -0.04909607 | -3.0577480 | 0.002997003 |
Papers using TNA
- Saqr, M., Lopez-Pernas, S., Tormanen, T., Kaliisa, R., Misiejuk, K., & Tikka, S. (2025). Transition Network Analysis: A Novel Framework for Modeling, Visualizing, and Identifying the Temporal Patterns of Learners and Learning Processes. Proceedings of the 15th International Learning Analytics and Knowledge Conference (LAK ’25), 351–361. ACM. https://doi.org/10.1145/3706468.3706513
- Tikka, S., Lopez-Pernas, S., & Saqr, M. (2025). tna: An R Package for Transition Network Analysis. Applied Psychological Measurement (online ahead of print). doi:10.1177/01466216251348840
- López-Pernas, S., Misiejuk, K., Kaliisa, R., & Saqr, M. (2025). Capturing the process of students’ AI interactions when creating and learning complex network structures. IEEE Transactions on Learning Technologies, 1–13. https://doi.org/10.1109/tlt.2025.3568599
- Törmänen, T., Saqr, M., López-Pernas, S., Mänty, K., Suoraniemi, J., Heikkala, N., & Järvenoja, H. (2025). Emotional dynamics and regulation in collaborative learning. Learning and Instruction, 100, 102188. https://doi.org/10.1016/j.learninstruc.2025.102188
- López-Pernas, S., Misiejuk, K., Oliveira, E., & Saqr, M. (2025). The dynamics of the self-regulation process in student-AI interactions: The case of problem-solving in programming education. Proceedings of the 25th Koli Calling International Conference on Computing Education Research, 1–12. https://doi.org/10.1145/3769994.3770043
- Misiejuk, K., Kaliisa, R., Lopez-Pernas, S., & Saqr, M. (2026). Expanding the Quantitative Ethnography Toolkit with Transition Network Analysis: Exploring Methodological Synergies and Boundaries. In Advances in Quantitative Ethnography. ICQE 2025, CCIS vol. 2677. Springer. https://doi.org/10.1007/978-3-032-12229-2_10
- Lopez-Pernas, S., Misiejuk, K., Tikka, S., & Saqr, M. (2026). Role Dynamics in Student-AI Collaboration: A Heterogeneous Transition Network Analysis Approach. SSRN preprint. https://doi.org/10.2139/ssrn.6082190