tidynorm
Tools for Tidy Vowel Normalization
An implementation of tidy speaker vowel normalization.
This includes generic functions for defining new normalization methods for
points, formant tracks, and Discrete Cosine Transform coefficients, as well
as convenience functions implementing established normalization methods.
References for the implemented methods are:
Johnson, Keith (2020)
tidynorm 

The goal of {tidynorm} is to provide convenient and tidy functions to
normalize vowel formant data.
Installation
You can install tidynorm like so
install.packages("tidynorm")
You can install the development version of tidynorm like so:
## if you need to install `remotes`
# install.packages("remotes")
remotes::install_github("jofrhwld/tidynorm")
Example
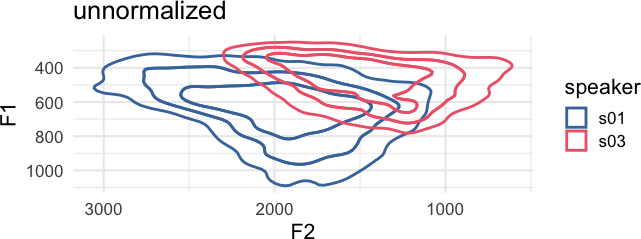
Vowel formant frequencies are heavily influenced by vocal tract length differences between speakers. Equivalent vowels between speakers can have dramatically different frequency locations.
library(tidynorm)
library(ggplot2)
Plotting Options
options(
  ggplot2.discrete.colour = c(
    lapply(
      1:6,
      \(x) c(
        "#4477AA", "#EE6677", "#228833",
        "#CCBB44", "#66CCEE", "#AA3377"
      )[1:x]
    )
  ),
  ggplot2.discrete.fill = c(
    lapply(
      1:6,
      \(x) c(
        "#4477AA", "#EE6677", "#228833",
        "#CCBB44", "#66CCEE", "#AA3377"
      )[1:x]
    )
  )
)

theme_set(
  theme_minimal(
    base_size = 16
  )
)
Plotting Code
ggplot(
  speaker_data,
  aes(
    F2, F1,
    color = speaker
  )
) +
  ggdensity::stat_hdr(
    probs = c(0.95, 0.8, 0.5),
    alpha = 1,
    fill = NA,
    linewidth = 1
  ) +
  scale_x_reverse() +
  scale_y_reverse() +
  coord_fixed() +
  labs(
    title = "unnormalized"
  )
The goal of {tidynorm} is to provide tidyverse-friendly and familiar
functions that will allow you to quickly normalize vowel formant data.
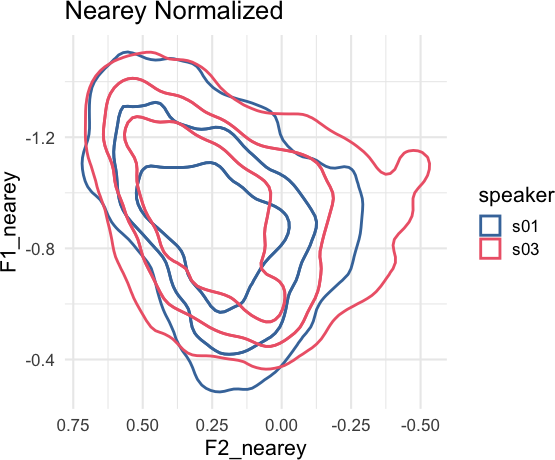
There are a number of built in functions based on conventional
normalization methods.
speaker_data |>
  norm_nearey(
    F1:F3,
    .by = speaker,
    .names = "{.formant}_nearey"
  ) ->
speaker_normalized
#> Normalization info
#> • normalized with `tidynorm::norm_nearey()`
#> • normalized `F1`, `F2`, and `F3`
#> • normalized values in `F1_nearey`, `F2_nearey`, and `F3_nearey`
#> • grouped by `speaker`
#> • within formant: FALSE
#> • (.formant - mean(.formant, na.rm = T))/(1)
Plotting Code
speaker_normalized |>
  ggplot(
    aes(
      F2_nearey, F1_nearey,
      color = speaker
    )
  ) +
  ggdensity::stat_hdr(
    probs = c(0.95, 0.8, 0.5),
    alpha = 1,
    fill = NA,
    linewidth = 1
  ) +
  scale_x_reverse() +
  scale_y_reverse() +
  coord_fixed() +
  labs(
    title = "Nearey Normalized"
  )
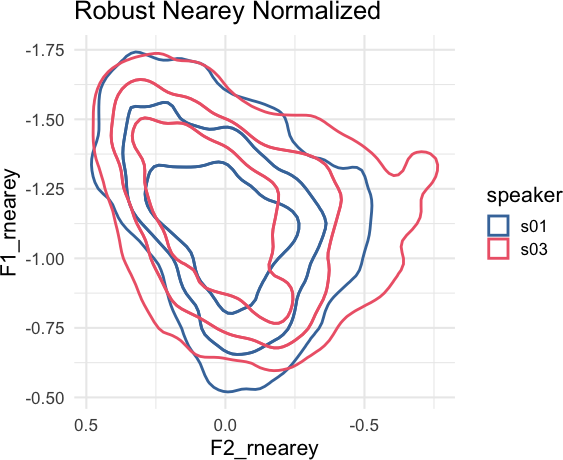
There is also a tidynorm::norm_generic() function to allow you to
define your own bespoke normalization methods. For example, a “robust
Nearey” normalization method using the median, instead of the mean,
could be done like so.
speaker_rnearey <- speaker_data |>
  norm_generic(
    F1:F3,
    .by = speaker,
    .by_formant = FALSE,
    .pre_trans = log,
    .L = median(.formant, na.rm = T),
    .names = "{.formant}_rnearey"
  )
#> Normalization info
#> • normalized with `tidynorm::norm_generic()`
#> • normalized `F1`, `F2`, and `F3`
#> • normalized values in `F1_rnearey`, `F2_rnearey`, and `F3_rnearey`
#> • grouped by `speaker`
#> • within formant: FALSE
#> • (.formant - median(.formant, na.rm = T))/(1)
Plotting Code
speaker_rnearey |>
  ggplot(
    aes(
      F2_rnearey, F1_rnearey,
      color = speaker
    )
  ) +
  ggdensity::stat_hdr(
    probs = c(0.95, 0.8, 0.5),
    alpha = 1,
    fill = NA,
    linewidth = 1
  ) +
  scale_x_reverse() +
  scale_y_reverse() +
  coord_fixed() +
  labs(
    title = "Robust Nearey Normalized"
  )