themis
Extra Recipes Steps for Dealing with Unbalanced Data
A dataset with an uneven number of cases in each class is
said to be unbalanced. Many models produce a subpar performance on
unbalanced datasets. A dataset can be balanced by increasing the
number of minority cases using SMOTE 2011
themis 



themis contains extra steps for the
recipes package for
dealing with unbalanced data. The name themis is that of the
ancient Greek
god
who is typically depicted with a balance.
themis handles imbalance in both classification and regression problems:
alongside the many classification samplers, step_smogn() resamples an
imbalanced numeric outcome. Its nearest-neighbor-based steps are also
not limited to Euclidean distance, the distance argument supports
euclidean, cosine, mahalanobis, manhattan, and chebyshev metrics.
Installation
You can install the released version of themis from CRAN with:
install.packages("themis")
Install the development version from GitHub with:
# install.packages("pak")
pak::pak("tidymodels/themis")
Example
Following is an example of using the SMOTE algorithm to deal with unbalanced data
library(recipes)
library(modeldata)
library(themis)

data("credit_data", package = "modeldata")

credit_data0 <- credit_data |>
  filter(!is.na(Job))

count(credit_data0, Job)
#>         Job    n
#> 1     fixed 2805
#> 2 freelance 1024
#> 3    others  171
#> 4   partime  452

ds_rec <- recipe(Job ~ Time + Age + Expenses, data = credit_data0) |>
  step_impute_mean(all_predictors()) |>
  step_smote(Job, over_ratio = 0.25) |>
  prep()

ds_rec |>
  bake(new_data = NULL) |>
  count(Job)
#> # A tibble: 4 × 2
#>   Job           n
#>   <fct>     <int>
#> 1 fixed      2805
#> 2 freelance  1024
#> 3 others      701
#> 4 partime     701
Methods
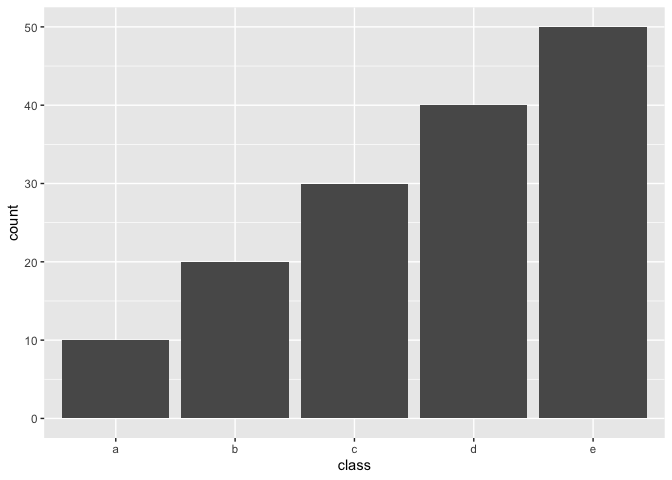
Below is some unbalanced data. Used for examples later.
example_data <- data.frame(class = letters[rep(1:5, 1:5 * 10)],
                           x = rnorm(150))

library(ggplot2)

example_data |>
  ggplot(aes(class)) +
  geom_bar()
Upsample / Over-sampling
The following methods all share the tuning parameter over_ratio, which
is the ratio of the minority-to-majority frequencies.
| name | function | Multi-class |
|---|---|---|
| Random minority over-sampling with replacement | step_upsample() |
:heavy_check_mark: |
| Synthetic Minority Over-sampling Technique | step_smote() |
:heavy_check_mark: |
| SMOTE for datasets with continuous and nominal features | step_smotenc() |
:heavy_check_mark: |
| SMOTE for nominal features only | step_smoten() |
:heavy_check_mark: |
| Borderline SMOTE-1 | step_bsmote(all_neighbors = FALSE) |
:heavy_check_mark: |
| Borderline SMOTE-2 | step_bsmote(all_neighbors = TRUE) |
:heavy_check_mark: |
| Support-vector SMOTE | step_svmsmote() |
:heavy_check_mark: |
| KMeans-SMOTE | step_kmeans_smote() |
:heavy_check_mark: |
| Adaptive synthetic sampling approach for imbalanced learning | step_adasyn() |
:heavy_check_mark: |
| Generation of synthetic data by Randomly Over Sampling Examples | step_rose() |
step_smogn() also over-samples, but for imbalanced regression rather
than classification: it resamples a numeric outcome instead of a class,
so it does not use over_ratio and is not shown in the table above.
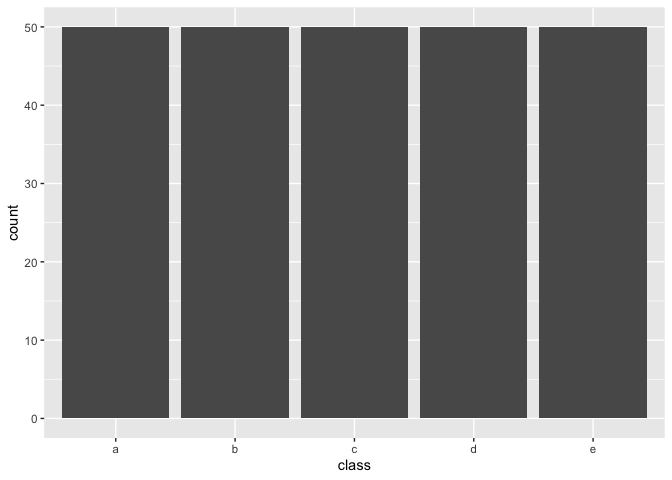
By setting over_ratio = 1 you bring the number of samples of all
minority classes equal to 100% of the majority class.
recipe(~., example_data) |>
  step_upsample(class, over_ratio = 1) |>
  prep() |>
  bake(new_data = NULL) |>
  ggplot(aes(class)) +
  geom_bar()
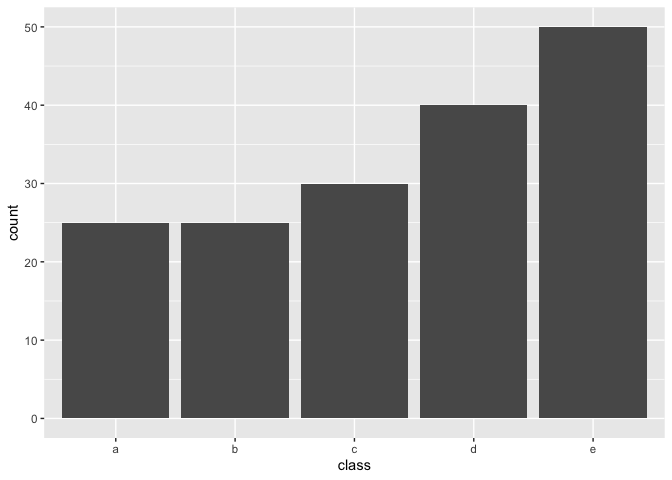
and by setting over_ratio = 0.5 we upsample any minority class with
fewer samples than 50% of the majority up to have 50% of the majority.
recipe(~., example_data) |>
  step_upsample(class, over_ratio = 0.5) |>
  prep() |>
  bake(new_data = NULL) |>
  ggplot(aes(class)) +
  geom_bar()
Downsample / Under-sampling
Most of the following methods all share the tuning parameter
under_ratio, which is the ratio of the majority-to-minority
frequencies.
| name | function | Multi-class | under_ratio |
|---|---|---|---|
| Random majority under-sampling with replacement | step_downsample() |
:heavy_check_mark: | :heavy_check_mark: |
| NearMiss-1, NearMiss-2, and NearMiss-3 | step_nearmiss(version = ) |
:heavy_check_mark: | :heavy_check_mark: |
| Instance hardness threshold | step_instance_hardness() |
:heavy_check_mark: | :heavy_check_mark: |
| Cluster centroids | step_cluster_centroids() |
:heavy_check_mark: | :heavy_check_mark: |
| Condensed nearest neighbors | step_cnn() |
:heavy_check_mark: | |
| Edited nearest neighbors | step_enn() |
:heavy_check_mark: | |
| Neighborhood cleaning rule | step_ncl() |
:heavy_check_mark: | |
| One-sided selection | step_oss() |
:heavy_check_mark: | |
| Extraction of majority-minority Tomek links | step_tomek() |
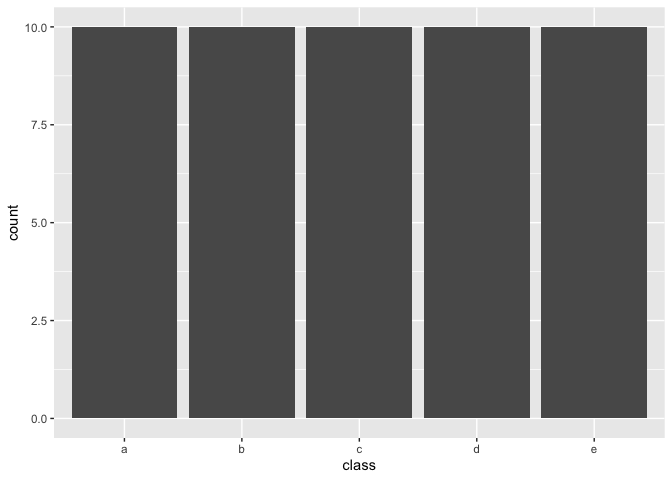
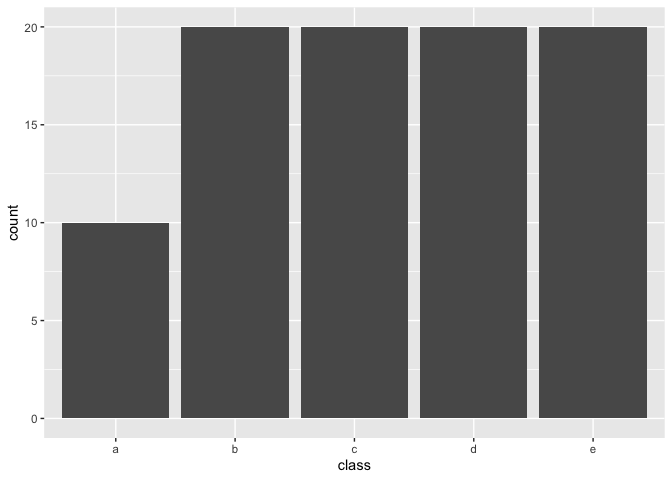
By setting under_ratio = 1 you bring the number of samples of all
majority classes equal to 100% of the minority class.
recipe(~., example_data) |>
  step_downsample(class, under_ratio = 1) |>
  prep() |>
  bake(new_data = NULL) |>
  ggplot(aes(class)) +
  geom_bar()
and by setting under_ratio = 2 we downsample any majority class with
more than 200% samples of the minority class down to have 200% samples
of the minority.
recipe(~., example_data) |>
  step_downsample(class, under_ratio = 2) |>
  prep() |>
  bake(new_data = NULL) |>
  ggplot(aes(class)) +
  geom_bar()
Contributing
This project is released with a Contributor Code of Conduct. By contributing to this project, you agree to abide by its terms.
-
For questions and discussions about tidymodels packages, modeling, and machine learning, join us on RStudio Community.
-
If you think you have encountered a bug, please submit an issue.
-
Either way, learn how to create and share a reprex (a minimal, reproducible example), to clearly communicate about your code.
-
Check out further details on contributing guidelines for tidymodels packages and how to get help.