shinyCohortBuilder
Modular Cohort-Building Framework for Analytical Dashboards
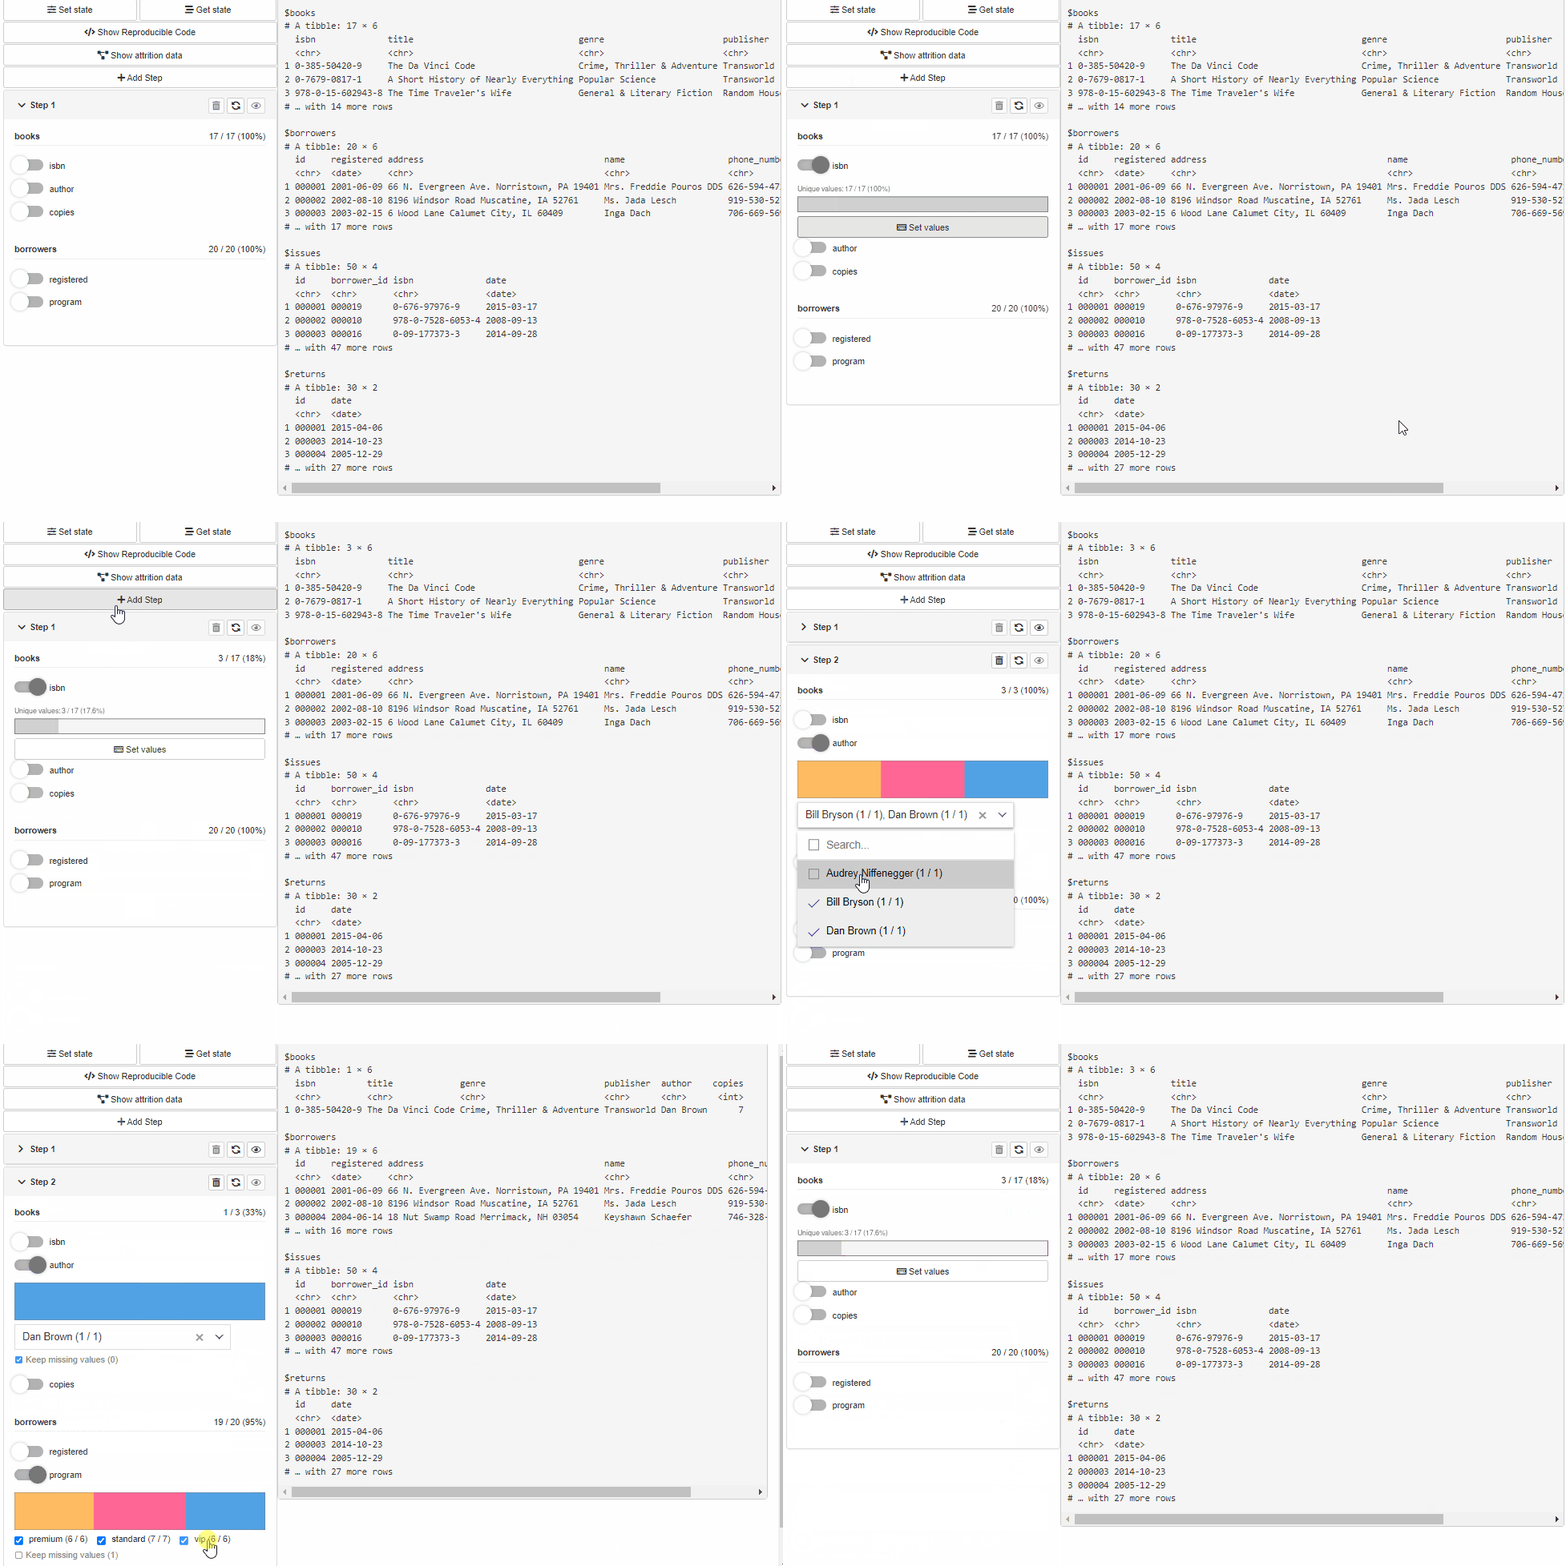
You can easily add advanced cohort-building component to your analytical dashboard or simple 'Shiny' app. Then you can instantly start building cohorts using multiple filters of different types, filtering datasets, and filtering steps. Filters can be complex and data-specific, and together with multiple filtering steps you can use complex filtering rules. The cohort-building sidebar panel allows you to easily work with filters, add and remove filtering steps. It helps you with handling missing values during filtering, and provides instant filtering feedback with filter feedback plots. The GUI panel is not only compatible with native shiny bookmarking, but also provides reproducible R code.
shinyCohortBuilder 
Move your cohortBuilder workflow to Shiny.


Installation
# CRAN version
install.packages("shinyCohortBuilder")

# Latest development version
remotes::install_github("https://github.com/r-world-devs/shinyCohortBuilder")
Overview
With shinyCohortBuilder you can use cohortBuilder features within
your shiny application.
Configure Source and Cohort filters with cohortBuilder (set
value/range to NA to select all the options / the whole range, and
active = FALSE to collapse filter in GUI):
librarian_source <- set_source(as.tblist(librarian))
librarian_cohort <- cohort(
  librarian_source,
  filter(
    "discrete", id = "author", dataset = "books",
    variable = "author", value = "Dan Brown",
    active = FALSE
  ),
  filter(
    "range", id = "copies", dataset = "books",
    variable = "copies", range = c(5, 10),
    active = FALSE
  ),
  filter(
    "date_range", id = "registered", dataset = "borrowers",
    variable = "registered", range = c(as.Date("2010-01-01"), Inf),
    active = FALSE
  )
)
And apply in your application with cb_ui and cb_server:
library(shiny)

ui <- fluidPage(
  sidebarLayout(
    sidebarPanel(
      cb_ui("librarian")
    ),
    mainPanel()
  )
)

server <- function(input, output, session) {
  cb_server("librarian", librarian_cohort)
}

shinyApp(ui, server)
You may listen to cohort data changes with
input[[<cohort-id>-data-updated]]:
library(shiny)

ui <- fluidPage(
  sidebarLayout(
    sidebarPanel(
      cb_ui("librarian")
    ),
    mainPanel(
      verbatimTextOutput("cohort_data")
    )
  )
)

server <- function(input, output, session) {
  cb_server("librarian", librarian_cohort)

  output$cohort_data <- renderPrint({
    input[["librarian-data-updated"]]
    get_data(librarian_cohort)
  })

}

shinyApp(ui, server)
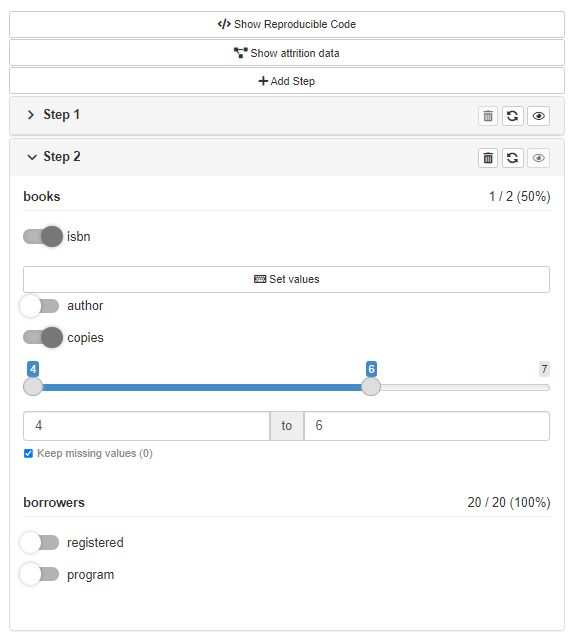
Or run filtering panel locally what just makes your work with
cohortBuilder easier:
gui(librarian_cohort)
If you’re interested in more features of shinyCohortBuilder please
visit the package
website.
Acknowledgement
Special thanks to:
- Kamil Wais for highlighting the need for the package and its relevance to real-world applications.
- Adam Foryś for technical support, numerous suggestions for the current and future implementation of the package.
- Paweł Kawski for indication of initial assumptions about the package based on real-world medical data.
Getting help
In a case you found any bugs, have feature request or general question please file an issue at the package Github. You may also contact the package author directly via email at [email protected].