palette
Color Scheme Helpers
Hexadecimal codes are typically used to represent colors in R. Connecting these codes to their colors requires practice or memorization. 'palette' provides a 'vctrs' class for working with color palettes, including printing and plotting functions. The goal of the class is to place visual representations of color palettes directly on or, at least, next to their corresponding character representations. Palette extensions also are provided for data frames using 'pillar'.
palette 



palette provides a lightweight infrastructure for working with color
palettes in R. The primary goal is to place colors directly next to
their character representations. To do this, we create a palette class
based on vctrs. We then provide
methods for this class, including print(), plot(), and
pillar. To keep it lightweight and usable
in other packages, the only direct dependencies are vctrs, cli, and
pillar.
Installation
You can install the development version of palette from GitHub with:
# install.packages('pak')
pak::pak('christopherkenny/palette')
Using palette
palette primarily provides a palette vctrs class. Using included
data, roygbiv, a length 7 vector of hex codes, we can create a
palette.
library(palette)
#>
#> Attaching package: 'palette'
#> The following object is masked from 'package:grDevices':
#>
#>     palette
palette(roygbiv)

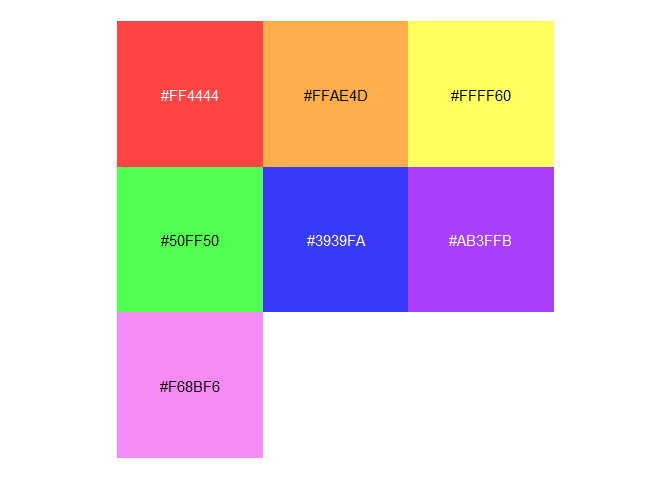
There is also a plot() method for visualizing the colors:
plot(palette(roygbiv))
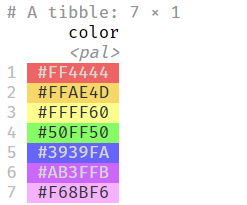
For use within tibbles, there is a pillar_shaft method:
tibble::tibble(
  color = palette(roygbiv)
)