omicsTools
Omics Data Processing Toolbox
Provides tools for processing and analyzing omics data from
genomics, transcriptomics, proteomics, and metabolomics platforms. Includes
data import, filtering, imputation, normalization, targeted
calibration, spectrum export, visualization,
statistical comparisons, and reproducible QC reports. The QC-RLSC
(quality control-based robust LOESS signal correction) algorithm is used
for normalization. Dunn et al. (2011)
omicsTools

An R package and Shiny app for omics data preparation, quality control, mass spectrometry, analysis, and plotting.
Start with a sample intensity table and optional metadata. Use the app to prepare data, review quality, compare groups, and export results, or call the same tools directly from R.
Install and open
install.packages("remotes")
remotes::install_github("cheemalab/omicsTools")
omicsTools::run_app()
Available tools
| Task | Brief usage |
|---|---|
| Prepare data and compare groups | Upload tables in Import & Preprocess, or use process_omics_data() to validate, filter, impute, normalize, and compare. |
| MS1 annotation | Enter m/z values in MS1 Annotation, or call ms1_annotation() with a database, ion mode, and mass tolerance. |
| SCIEX/Qtrap QC | Import SCIEX exports in SCIEX Pipeline or use 7500/5500 Qtrap for internal-standard normalization and QC review. |
| Calibration | Supply known concentrations and responses in Targeted Calibration, or use fit_targeted_calibration() and predict_targeted_calibration(). |
| Sample QC and metadata | Use detect_sample_outliers() on a numeric feature matrix, or generate_sample_metadata() to split sample names into fields. |
| Plots and exports | Use plot_omics_pca(), plot_omics_heatmap(), or plot_peak_list(). Export the workflow tables and QC report with export_omics_results(). |
The app includes PCA, heatmap, and LC-MS feature screens. Group comparisons produce a volcano plot in the workflow results.
Workflow
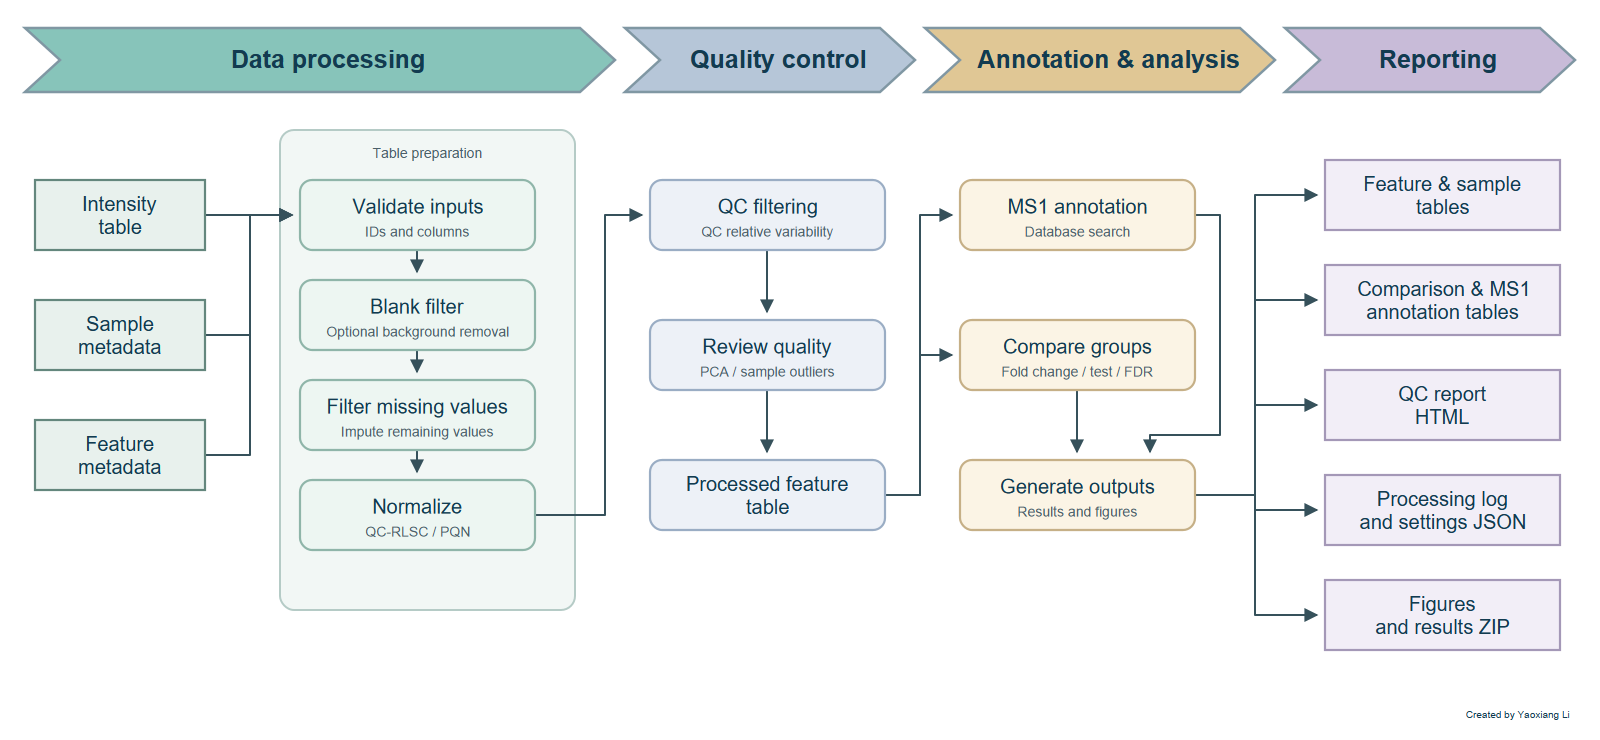
The workflow is available from the Import & Preprocess screen or directly in R.
Run the workflow in R
Intensity tables use one row per sample. Sample metadata use the same sample ID column. Feature metadata use feature_id, with optional mz and rt (seconds).
result <- omicsTools::process_omics_data(
  intensities,
  sample_info = samples,
  feature_info = features,
  sample_type_col = "sample_type",
  blank_filter = TRUE,
  group_col = "group",
  reference = "control",
  comparison = "case"
)
omicsTools::export_omics_results(result, "results")
The results directory contains the intensity, sample, feature, comparison, QC, and blank-filter tables, a processing record, settings, and an HTML QC report. The report includes before/after PCA.
MS1 annotation
install.packages("cmmr")
omicsTools::ms1_annotation(
  c(181.07267, 203.05461),
  masstole = 10,
  toleUnit = "ppm",
  annotaDB = "hmdb",
  ionMode = "pos"
)
Optional packages provide MS1 searches (cmmr), Excel import (readxl), Excel summaries (openxlsx), and ZIP exports (zip).
License: AGPL (>= 3).