healthyR
Hospital Data Analysis Workflow Tools
Hospital data analysis workflow tools, modeling, and automations. This library provides many useful tools to review common administrative hospital data. Some of these include average length of stay, readmission rates, average net pay amounts by service lines just to name a few. The aim is to provide a simple and consistent verb framework that takes the guesswork out of everything.
healthyR 


The goal of healthyR is to help quickly analyze common data problems in the Administrative and Clincial spaces.
Installation
You can install the released version of healthyR from CRAN with:
install.packages("healthyR")
And the development version from GitHub with:
# install.packages("devtools")
devtools::install_github("spsanderson/healthyR")
Example
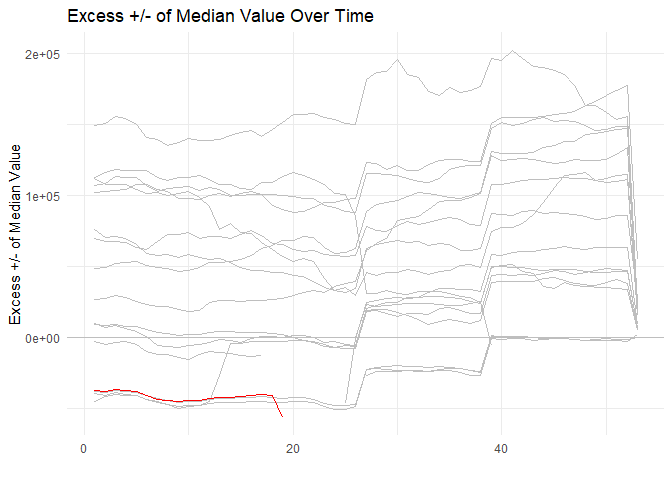
This is a basic example of using the ts_median_excess_plt() function`:
library(healthyR)
library(timetk)
library(dplyr)

ts_signature_tbl(.data = m4_daily, .date_col = date, .pad_time = TRUE, id) %>%
    ts_median_excess_plt(
        .date_col           = date
        , .value_col        = value
        , .x_axis           = week
        , .ggplot_group_var = year
        , .years_back       = 5
    )
Here is a simple example of using the ts_signature_tbl() function:
library(healthyR)
library(timetk)

ts_signature_tbl(.data = m4_daily, .date_col = date)
#> # A tibble: 17,578 × 31
#>    id    date       value index.num  diff  year year.iso  half quarter month
#>    <fct> <date>     <dbl>     <dbl> <dbl> <int>    <int> <int>   <int> <int>
#>  1 D410  1978-06-23 9109. 267408000    NA  1978     1978     1       2     6
#>  2 D410  1978-06-24 9103. 267494400 86400  1978     1978     1       2     6
#>  3 D410  1978-06-25 9116. 267580800 86400  1978     1978     1       2     6
#>  4 D410  1978-06-26 9116. 267667200 86400  1978     1978     1       2     6
#>  5 D410  1978-06-27 9106. 267753600 86400  1978     1978     1       2     6
#>  6 D410  1978-06-28 9094. 267840000 86400  1978     1978     1       2     6
#>  7 D410  1978-06-29 9094. 267926400 86400  1978     1978     1       2     6
#>  8 D410  1978-06-30 9084. 268012800 86400  1978     1978     1       2     6
#>  9 D410  1978-07-01 9081. 268099200 86400  1978     1978     2       3     7
#> 10 D410  1978-07-02 9047. 268185600 86400  1978     1978     2       3     7
#> # ℹ 17,568 more rows
#> # ℹ 21 more variables: month.xts <int>, month.lbl <ord>, day <int>, hour <int>,
#> #   minute <int>, second <int>, hour12 <int>, am.pm <int>, wday <int>,
#> #   wday.xts <int>, wday.lbl <ord>, mday <int>, qday <int>, yday <int>,
#> #   mweek <int>, week <int>, week.iso <int>, week2 <int>, week3 <int>,
#> #   week4 <int>, mday7 <int>
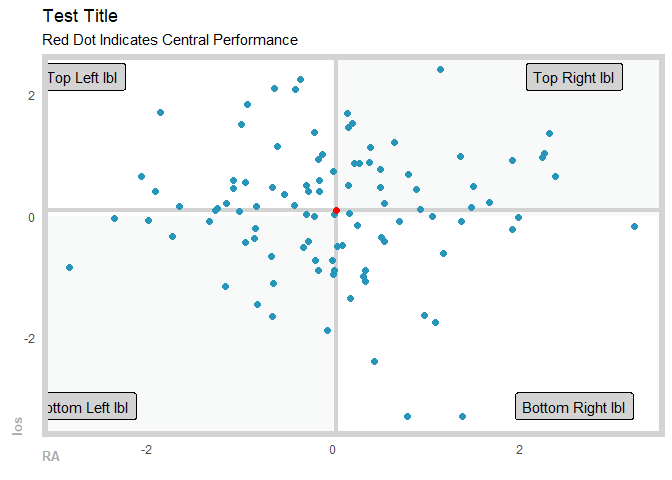
Here is a simple example of using the plt_gartner_magic_chart() function:
suppressPackageStartupMessages(library(healthyR))
suppressPackageStartupMessages(library(tibble))
suppressPackageStartupMessages(library(dplyr))

gartner_magic_chart_plt(
  .data = tibble(x = rnorm(100, 0, 1), y = rnorm(100, 0, 1))
  , .x_col = x
  , .y_col = y
  , .y_lab = "los"
  , .x_lab = "RA"
  , .plot_title = "Test Title"
  , .top_left_label = "Top Left lbl"
  , .top_right_label = "Top Right lbl"
  , .bottom_left_label = "Bottom Left lbl"
  , .bottom_right_label = "Bottom Right lbl"
)