gtreg
Regulatory Tables for Clinical Research
Creates tables suitable for regulatory agency submission by leveraging the 'gtsummary' package as the back end. Tables can be exported to HTML, Word, PDF and more. Highly customized outputs are available by utilizing existing styling functions from 'gtsummary' as well as custom options designed for regulatory tables.
gtreg 



Installation
You can install {gtreg} with the following code.
install.packages("gtreg")
You can install the development version of {gtreg} from GitHub with:
# install.packages("devtools")
devtools::install_github("shannonpileggi/gtreg")
Overview
The {gtreg} package creates tabular data summaries appropriate for regulatory submissions. The package builds the tables using {gtsummary}.
Here are slides and a recorded talk (17 min) from “Introducing {gtreg}: an R package to produce regulatory tables for clinical research” presented at the 2022 R in Medicine conference.

Functions for adverse event (AE) reporting
Summarize Raw Adverse Counts
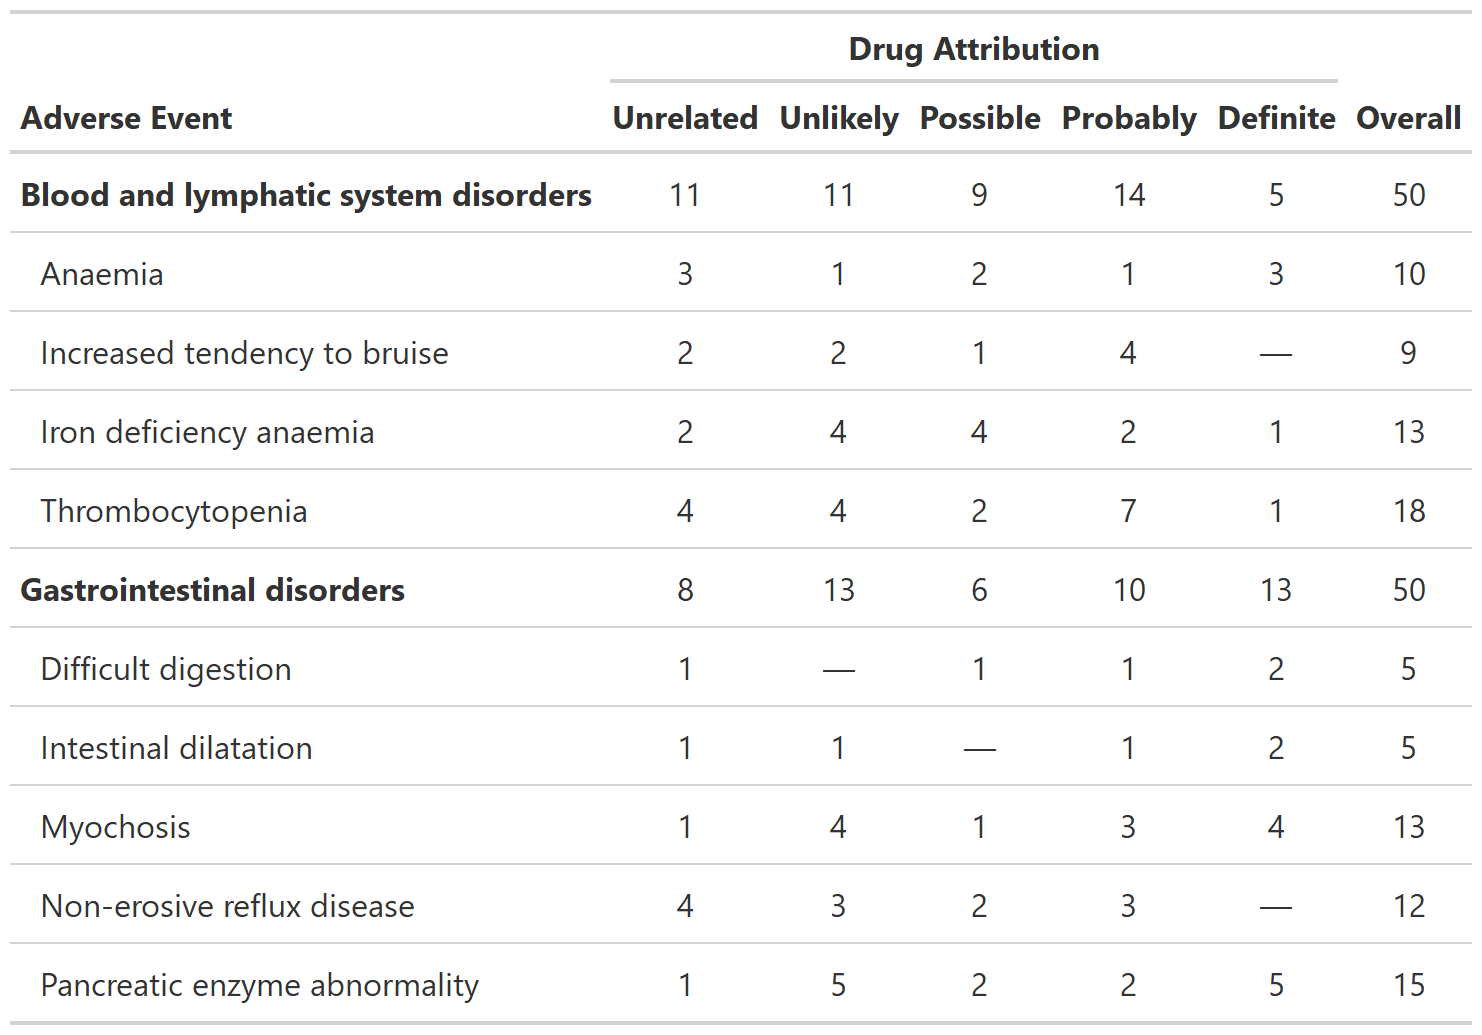
tbl_ae_count() provides counts of all AEs, and omits percentage
statistics as multiple AEs can occur per subject.
library(gtreg)
tbl_ae_count <-
  df_adverse_events |>
  tbl_ae_count(
    ae = adverse_event,
    soc = system_organ_class,
    by = drug_attribution
  ) |>
  add_overall(across = "by") |>
  modify_spanning_header(all_ae_cols() ~ "**Drug Attribution**") |>
  bold_labels()
Summarize Adverse Events by Grade
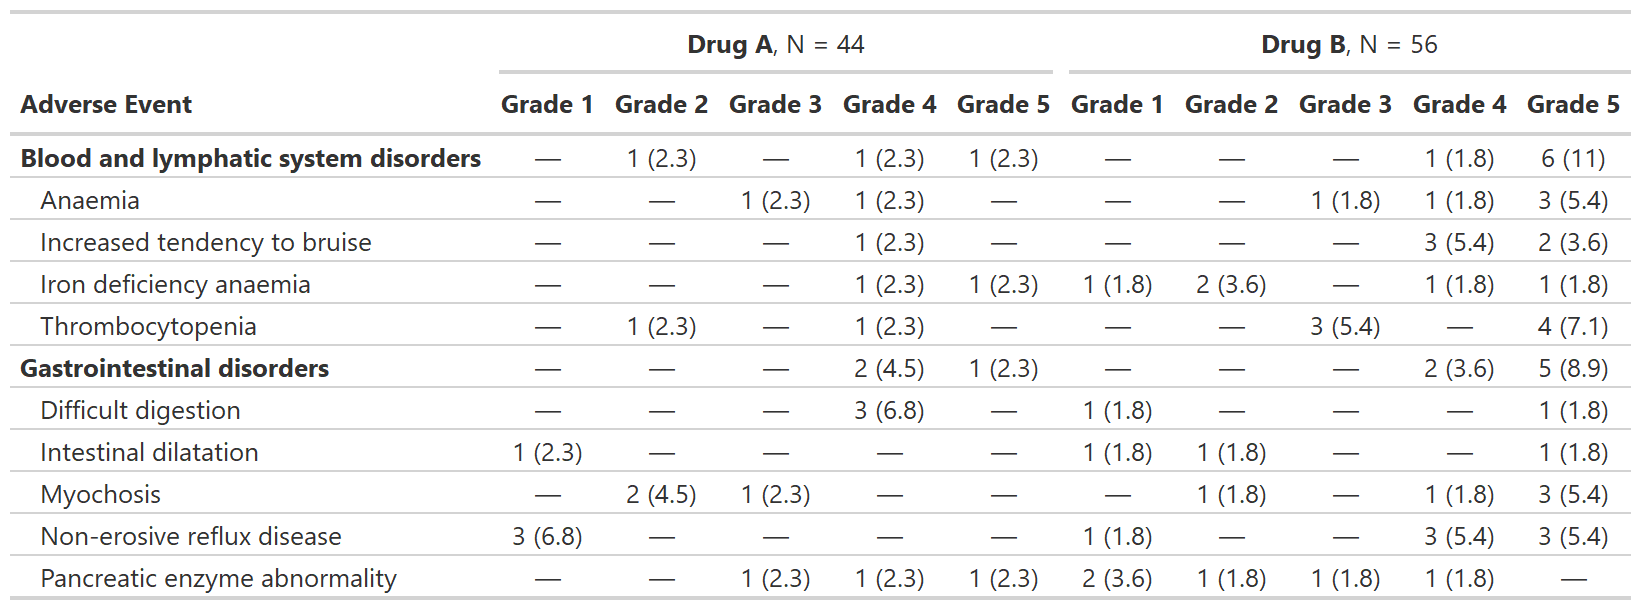
tbl_ae() counts one AE per subject by maximum grade; percentage
statistics are provided by default with the denominators reflecting the
number of patients in the study.
library(gtreg)
gtsummary::theme_gtsummary_compact()
#> Setting theme "Compact"

tbl_ae <-
  df_adverse_events |>
  tbl_ae(
    id_df = df_patient_characteristics,
    id = patient_id,
    ae = adverse_event,
    soc = system_organ_class,
    by = grade,
    strata = trt
  ) |>
  modify_header(all_ae_cols() ~ "**Grade {by}**") |>
  bold_labels()
Focus on rates of high grade complications
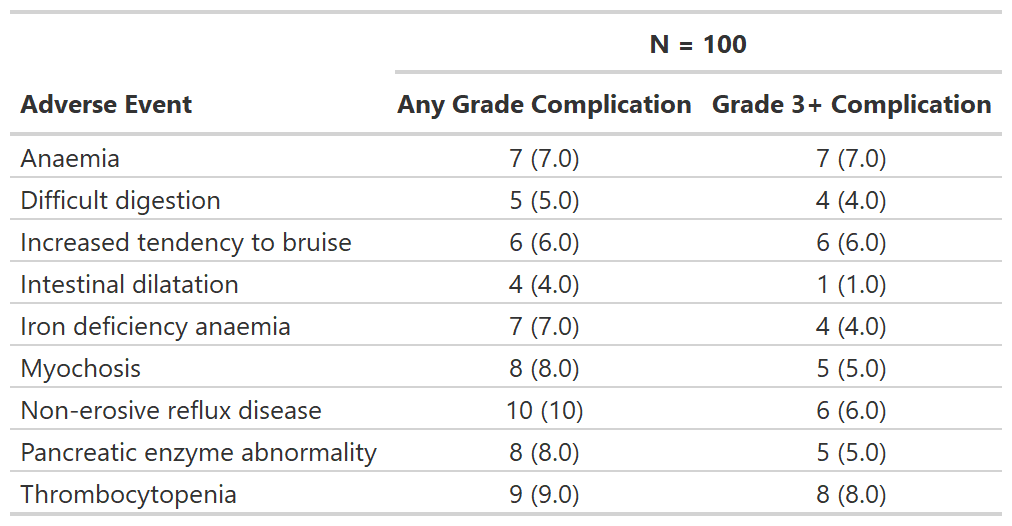
tbl_ae_focus() also counts one AE per subject by maximum grade, and is
a convenience to summarize dichotomous AE attributes.
tbl_ae_focus <-
  df_adverse_events |>
  tbl_ae_focus(
    id_df = df_patient_characteristics,
    id = patient_id,
    ae = adverse_event,
    include = c(any_complication, grade3_complication)
  )
Other Functions for Clinical Reporting
Regulatory summary
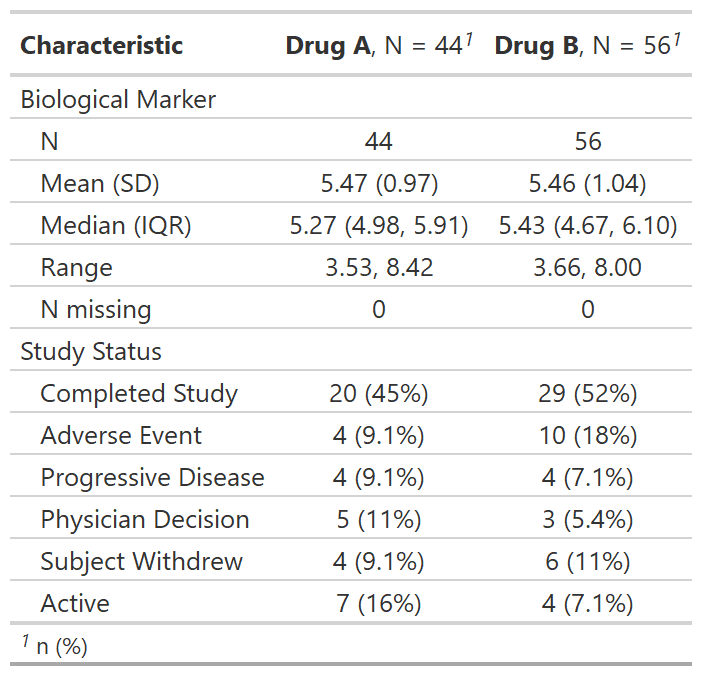
tbl_reg_summary() creates a data summary table often seen in
regulatory submissions.
tbl_reg_summary <-
  df_patient_characteristics |>
  tbl_reg_summary(by = trt, include = c(marker, status))
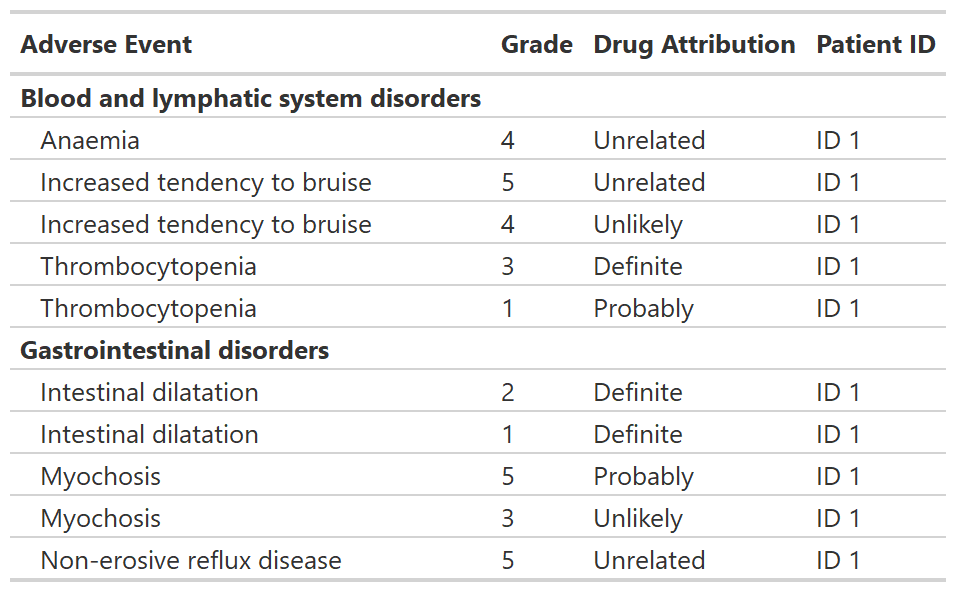
Print an AE listing
tbl_listing() creates a gtsummary-class listing of data to enable
grouped printing.
tbl_listing <-
  head(df_adverse_events, n = 10) |>
  select(system_organ_class, adverse_event, grade, drug_attribution, patient_id) |>
  dplyr::arrange(adverse_event, desc(grade)) |>
  tbl_listing(group_by = system_organ_class) |>
  bold_labels()
Code of Conduct
Please note that the gtreg project is released with a Contributor Code of Conduct. By contributing to this project, you agree to abide by its terms.