ggseg
Plotting Tool for Brain Atlases
Provides a 'ggplot2' geom and position for visualizing brain
region data on cortical, subcortical, and white matter tract atlases.
Brain atlas geometries are stored as polygon data, enabling
seamless integration with the 'ggplot2' ecosystem including faceting,
custom scales, and themes. Mowinckel & Vidal-Piñeiro (2020)
ggseg 






Neuroimaging analyses produce region-level results – cortical thickness, p-values, network assignments – that need to end up on a brain figure. ggseg stores brain atlas geometries as simple features and plots them as ggplot2 layers, so you get publication-ready brain figures with the same code you’d use for any other ggplot.
Mowinckel & Vidal-Piñeiro (2020). Visualization of Brain Statistics With R Packages ggseg and ggseg3d. Advances in Methods and Practices in Psychological Science.
Installation
Install from CRAN:
install.packages("ggseg")
Or get the development version from the ggsegverse r-universe:
options(repos = c(
  ggsegverse = "https://ggsegverse.r-universe.dev",
  CRAN = "https://cloud.r-project.org"
))
install.packages("ggseg")
Quick start
library(ggseg)
library(ggplot2)
Built-in atlases
ggseg ships with three atlases: dk (Desikan-Killiany cortical
parcellation), aseg (automatic subcortical segmentation), and
tracula (white matter tracts). plot() gives you a quick overview:
plot(dk())
plot(aseg())
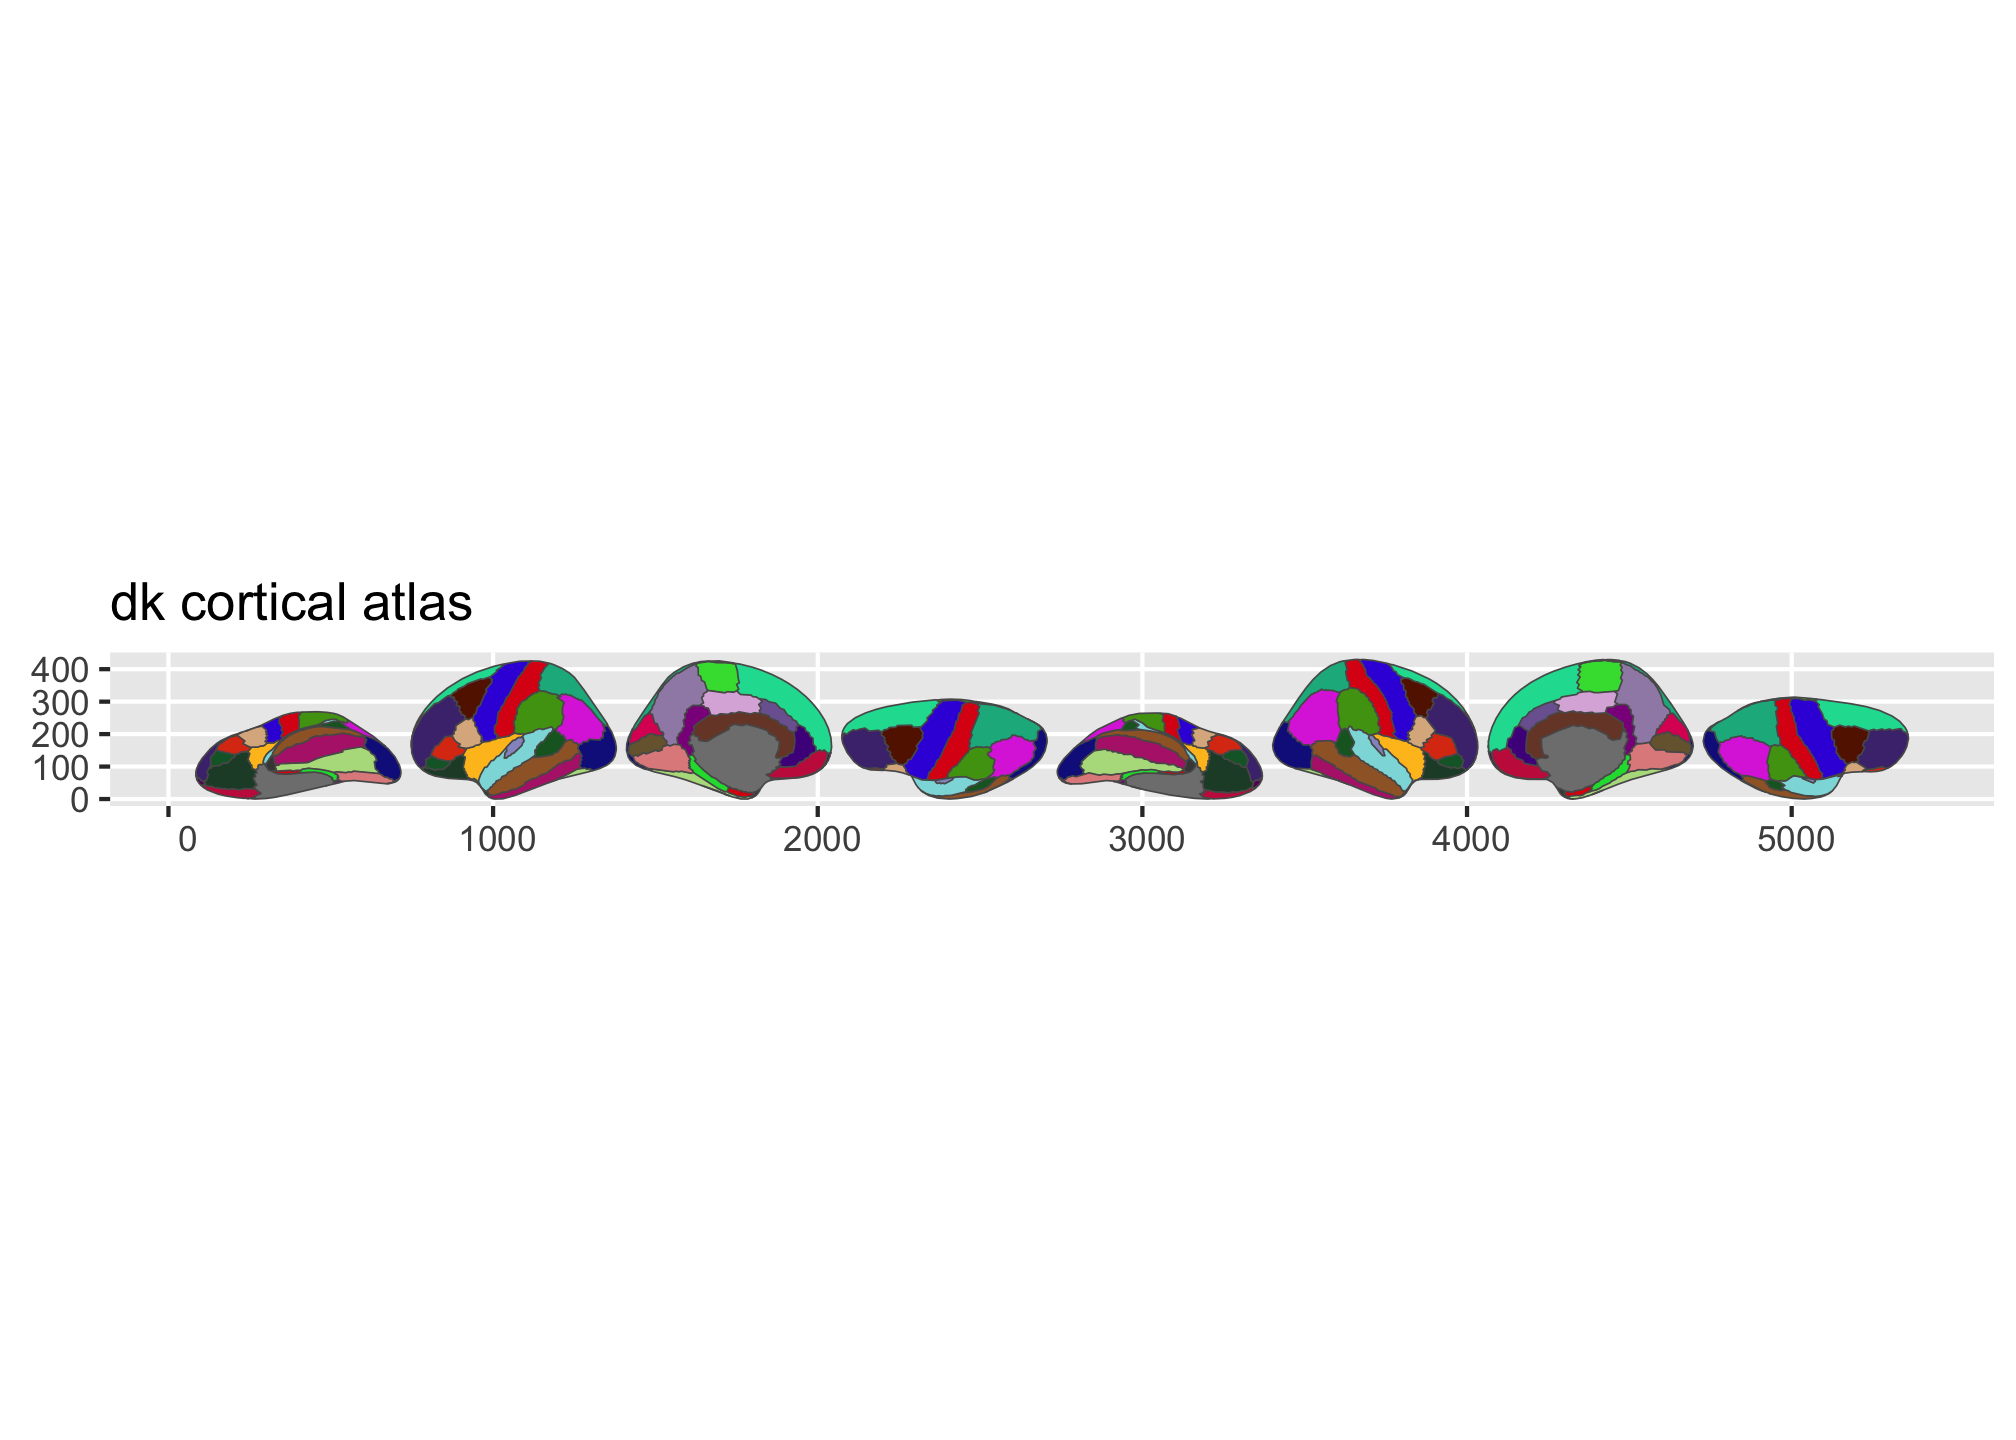
Figure 1: Overview of the dk and aseg built-in brain atlases.
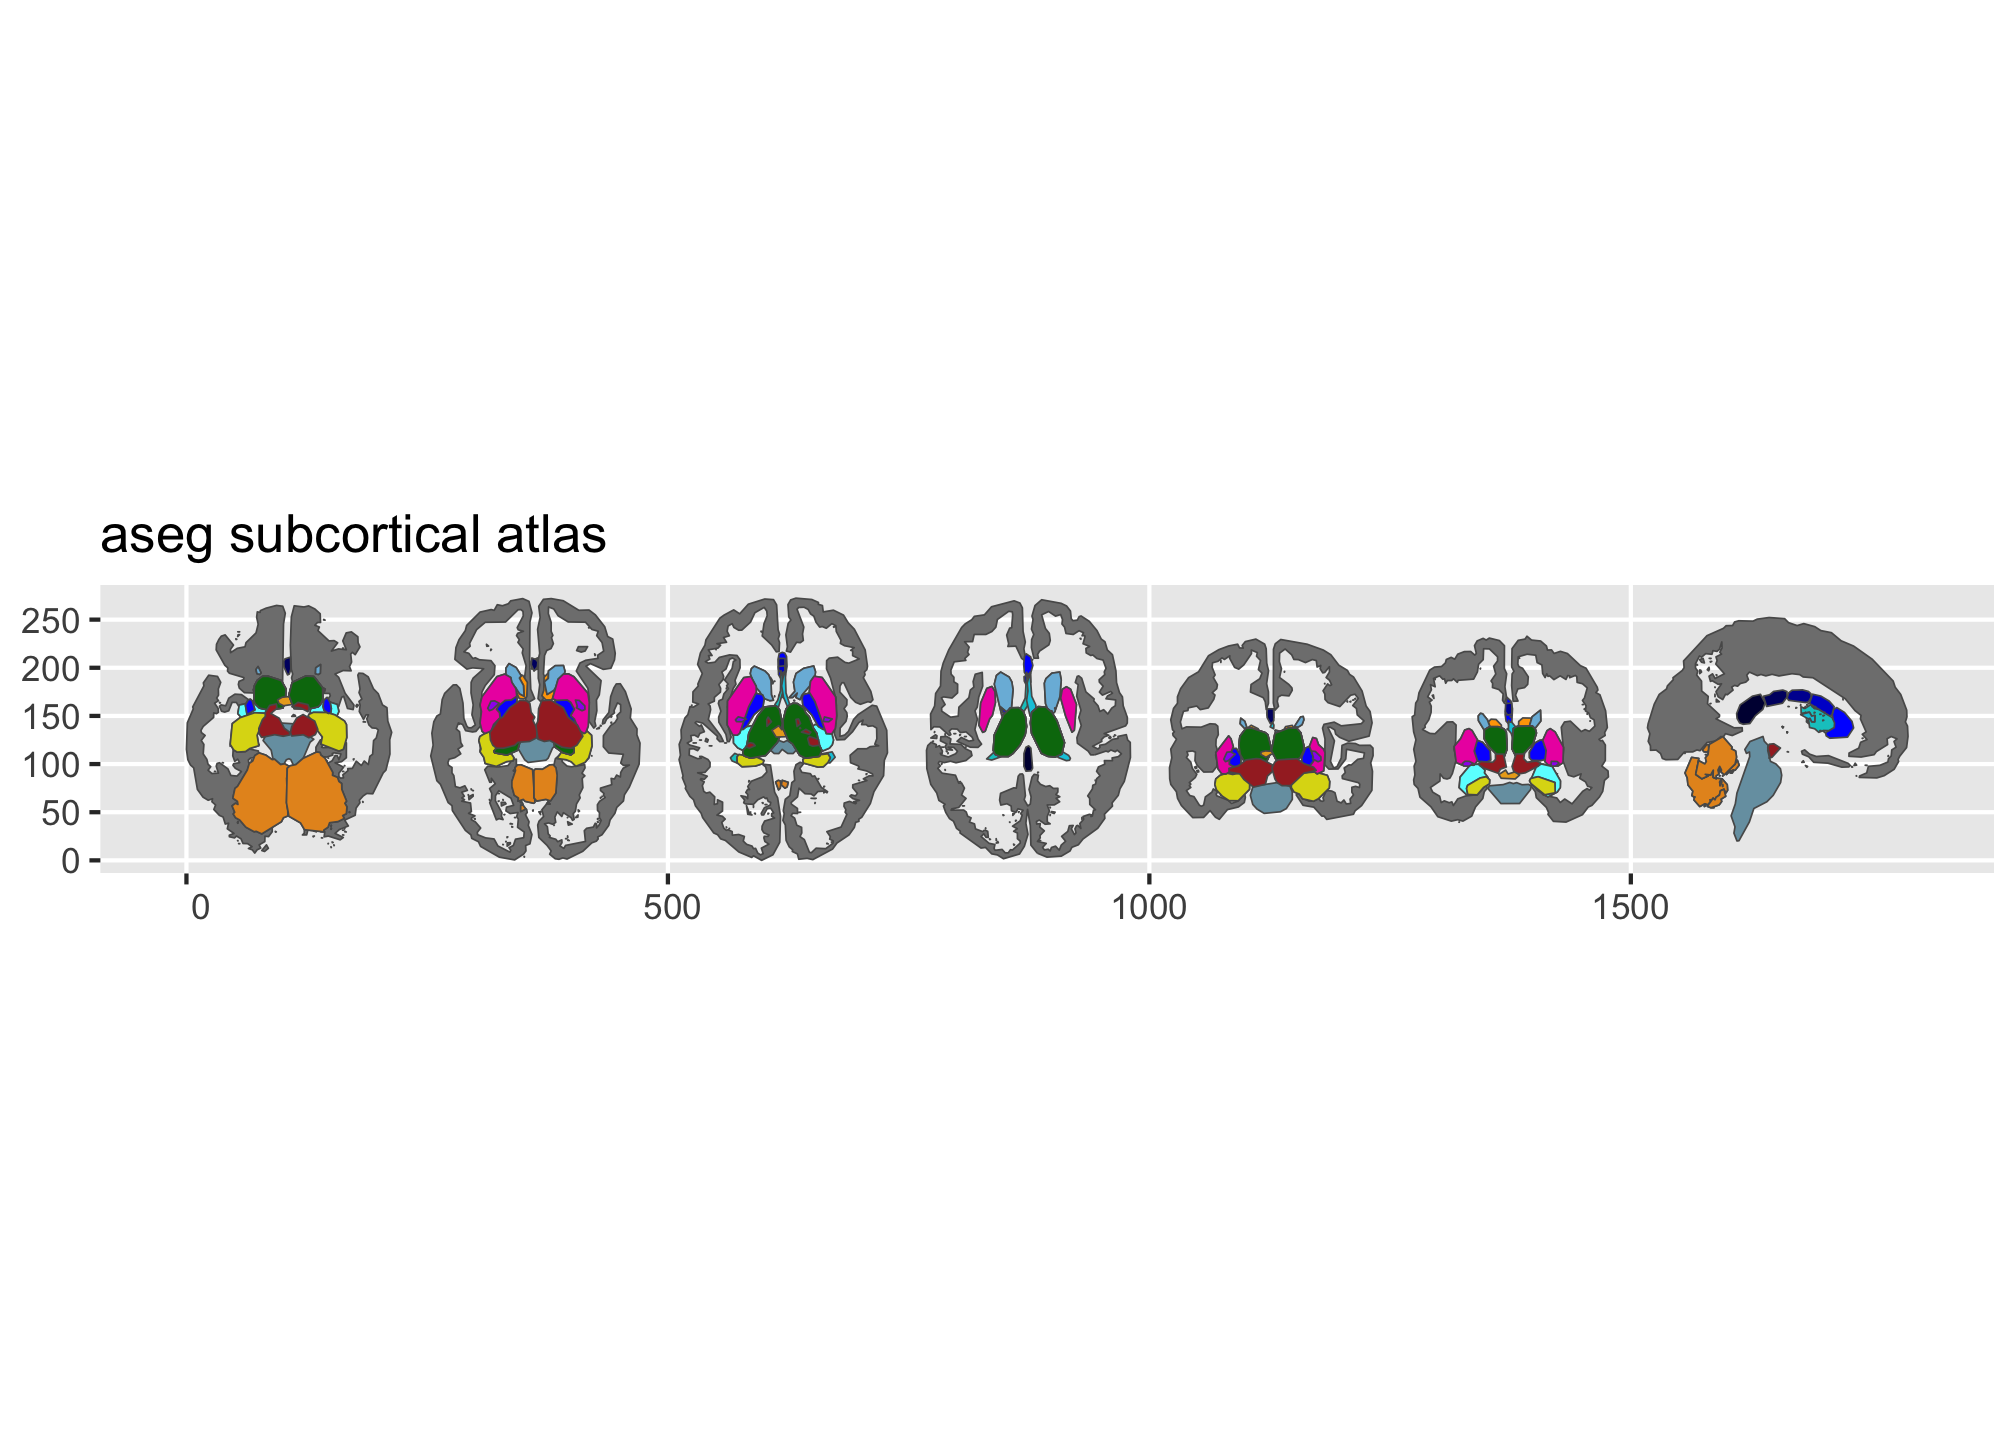
Figure 2: Overview of the dk and aseg built-in brain atlases.
Plotting your own data
Pass a data frame to ggplot() with a column that matches the atlas
(typically region or label). geom_brain() handles the join:
library(dplyr)

some_data <- tibble(
  region = rep(
    c(
      "transverse temporal",
      "insula",
      "precentral",
      "superior parietal"
    ),
    2
  ),
  p = sample(seq(0, .5, .001), 8),
  groups = c(rep("g1", 4), rep("g2", 4))
)

ggplot(some_data) +
  geom_brain(
    atlas = dk(),
    position = position_brain(hemi ~ view),
    aes(fill = p)
  ) +
  facet_wrap(~groups) +
  scale_fill_viridis_c(option = "cividis", direction = -1) +
  theme_void()
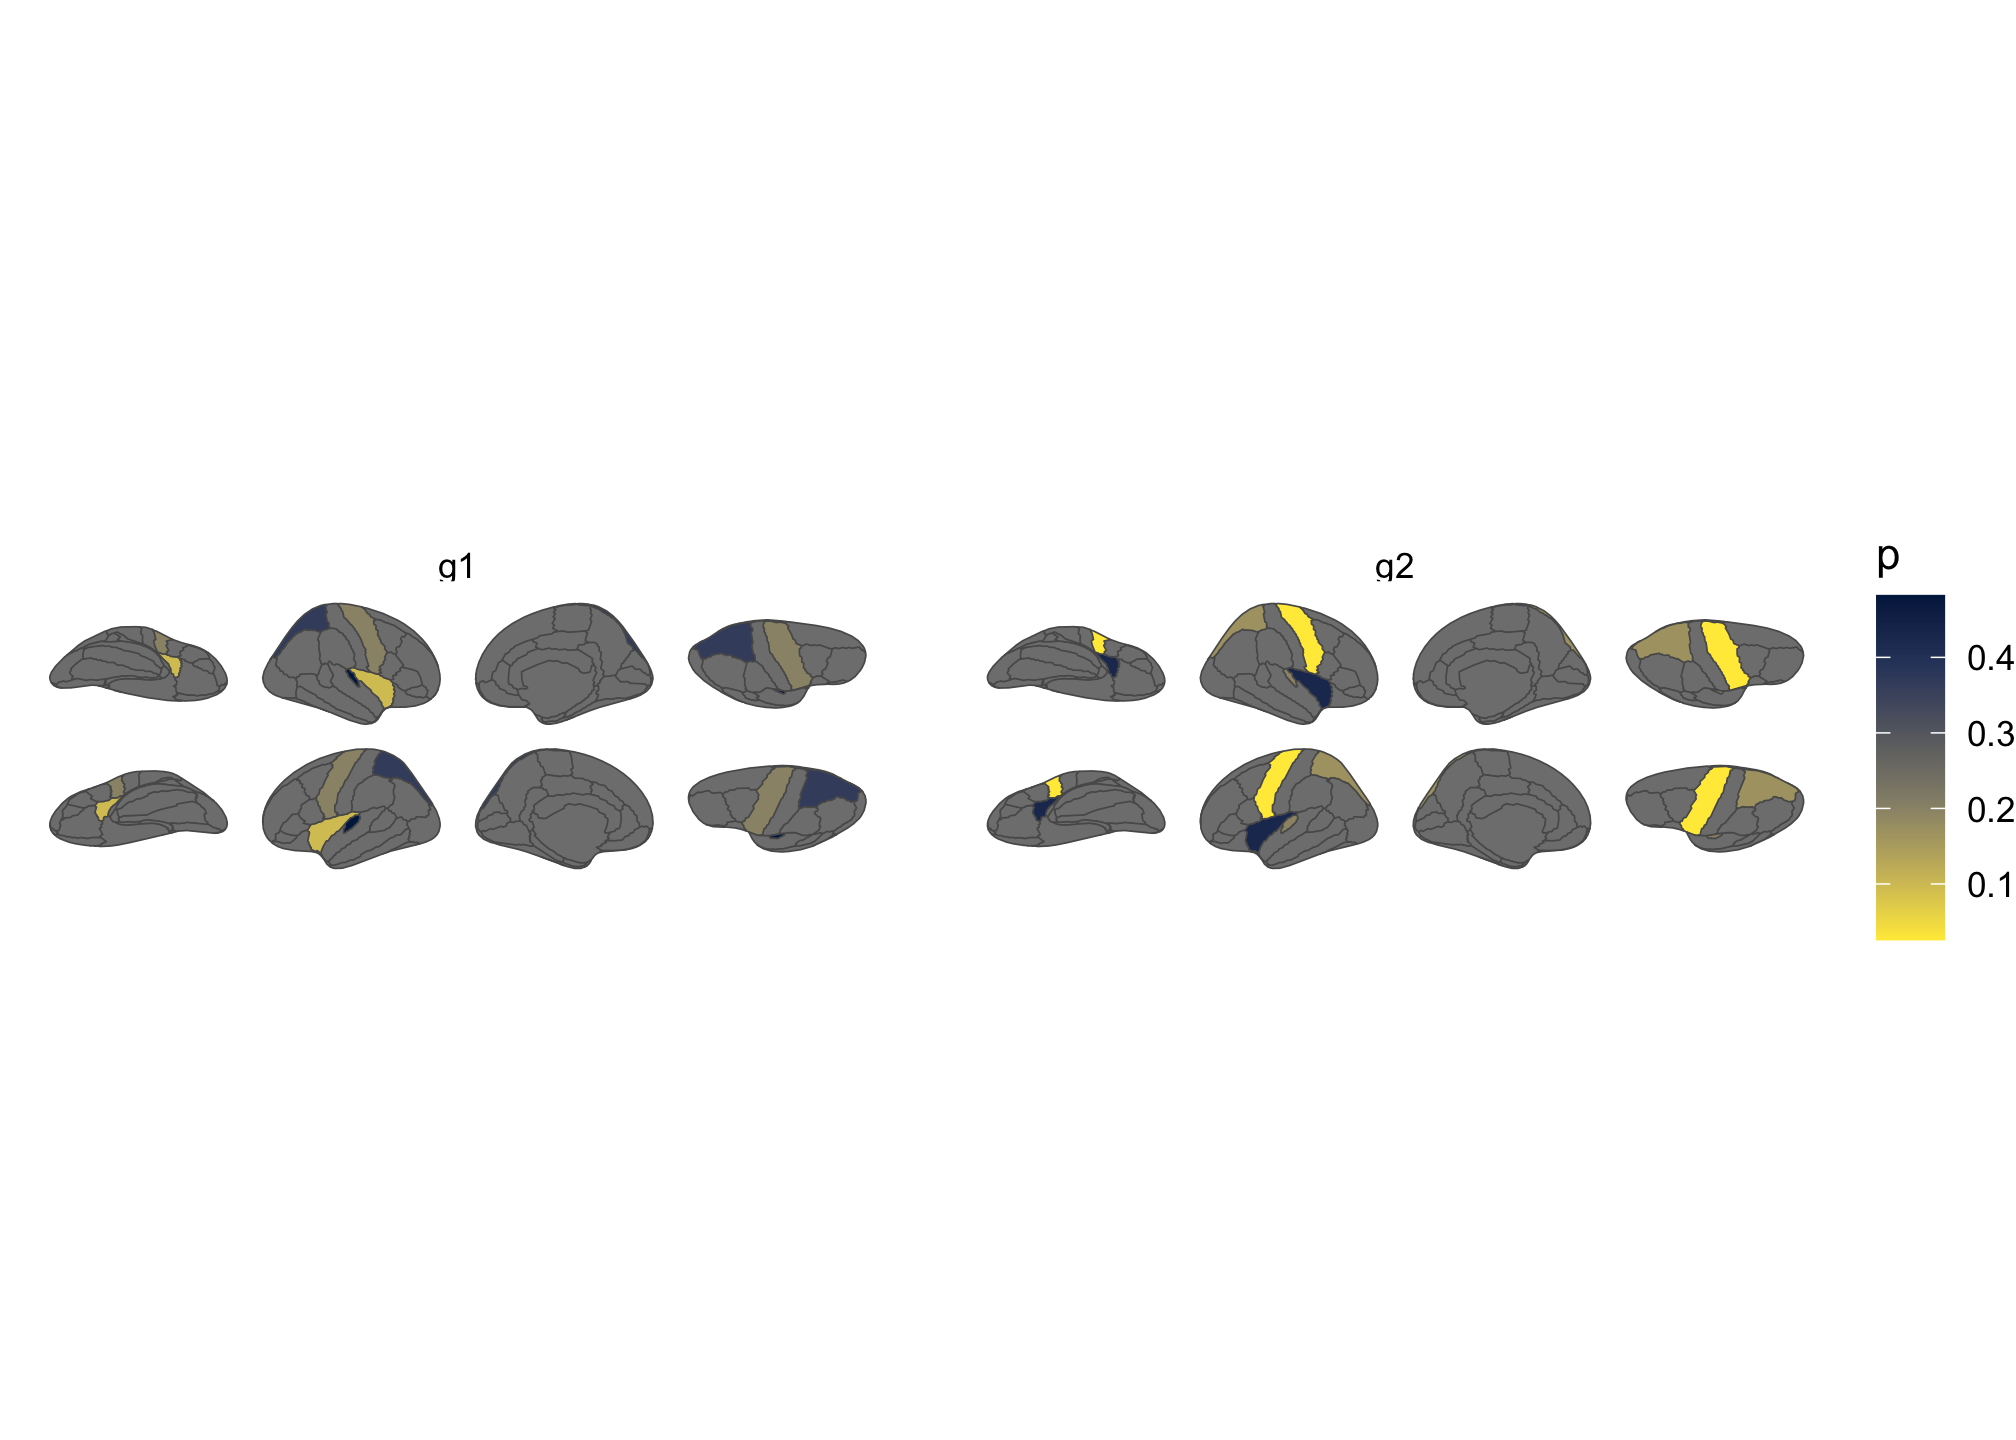
Figure 3: Brain plot coloured by external data, faceted by group.
More atlases
Many additional atlases are available through the ggsegverse r-universe:
install.packages("ggsegYeo2011", repos = "https://ggsegverse.r-universe.dev")
Learn more
The package website has vignettes
covering external data, view positioning, the geom_sf() workflow, and
reading FreeSurfer stats files.
Funding
This tool is partly funded by:
EU Horizon 2020 Grant: Healthy minds 0-100 years: Optimising the use of European brain imaging cohorts (Lifebrain). Grant agreement number: 732592.