ggeasy
Easy Access to 'ggplot2' Commands
Provides a series of aliases to commonly used but difficult to remember 'ggplot2' sequences.
ggeasy 



You know how to make ggplot2 graphics, right? No worries. Piece of
cake.
Now, can you please rotate the x axis labels to vertical?

ggeasy is here to make that a little easier.
Installation
You can install the latest released version of ggeasy from CRAN with:
install.packages("ggeasy")
or the bleeding-edge development version from GitHub with
# install.packages("remotes")
remotes::install_github("jonocarroll/ggeasy")
Reference
See the pkgdown site.
@amrrs a.k.a.
@1littlecoder has produced a video
walkthrough using ggeasy which covers some of the major features:

Sharon Machlis has a great article detailing using the package, as well as a video
Examples
library(ggplot2)
library(ggeasy)

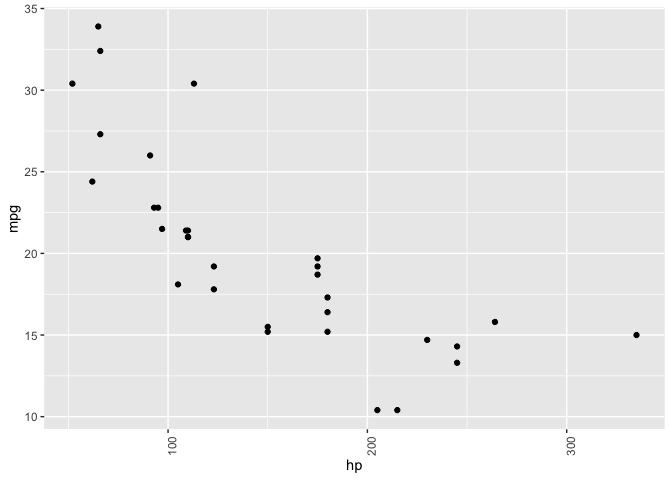
# rotate x axis labels
ggplot(mtcars, aes(hp, mpg)) +
    geom_point() +
    easy_rotate_x_labels()
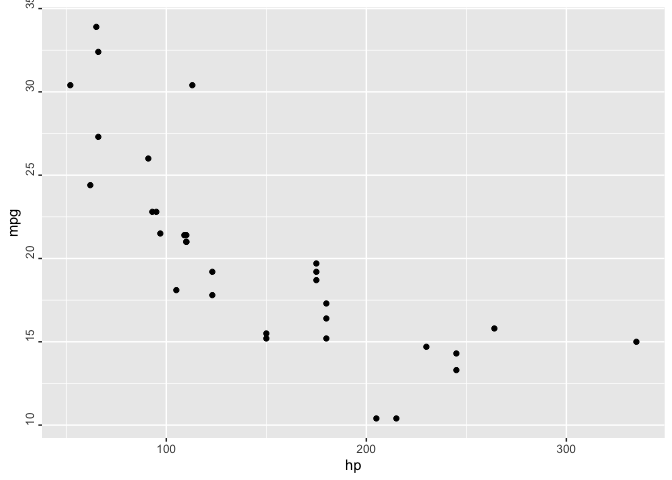
# rotate y axis labels
ggplot(mtcars, aes(hp, mpg)) +
    geom_point() +
    easy_rotate_y_labels()
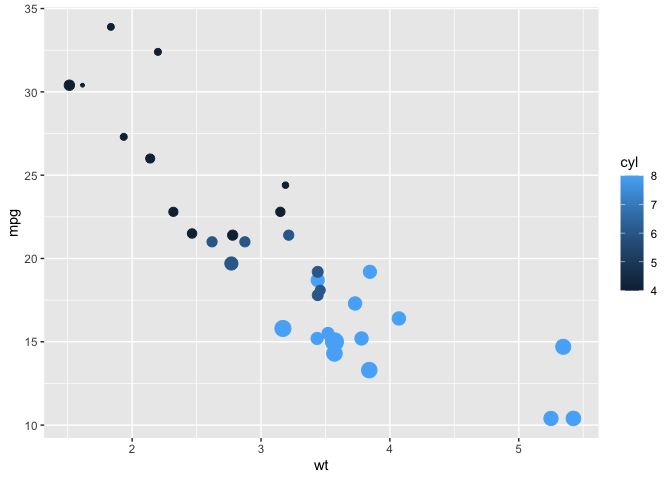
# remove 'size' legend
ggplot(mtcars, aes(wt, mpg, colour = cyl, size = hp)) +
    geom_point() +
    easy_remove_legend(size)
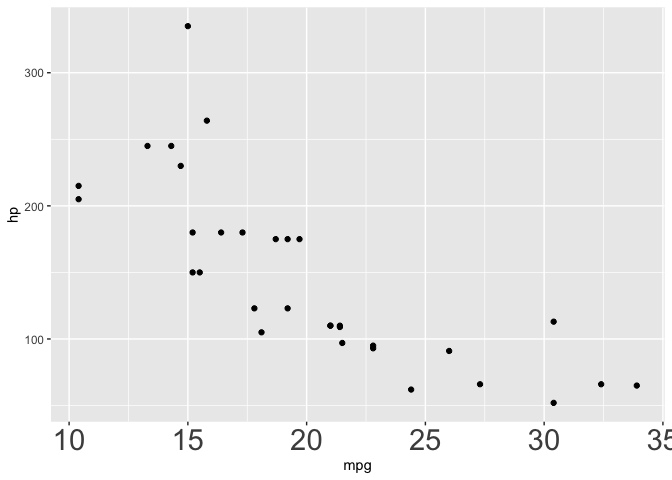
# make the x axis labels larger
ggplot(mtcars, aes(mpg, hp)) +
  geom_point() +
  easy_x_axis_labels_size(22)
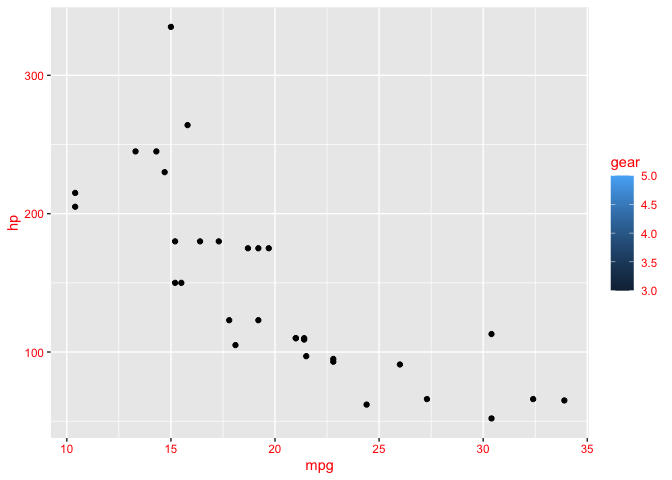
# make all the text red
ggplot(mtcars, aes(mpg, hp)) +
  geom_point(aes(fill = gear)) +
  easy_all_text_color("red")
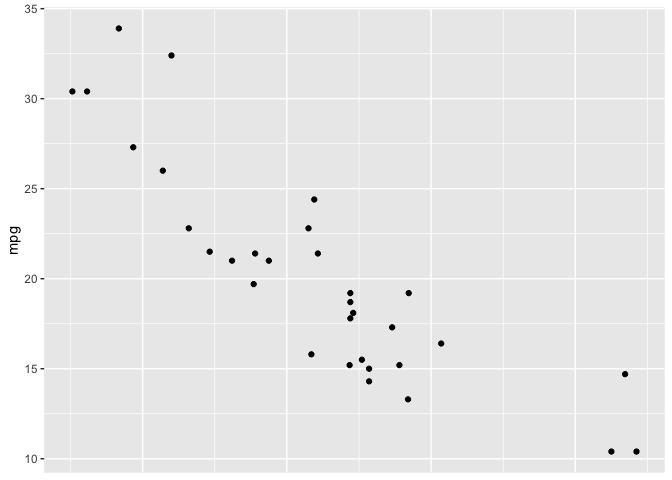
# remove just x axis
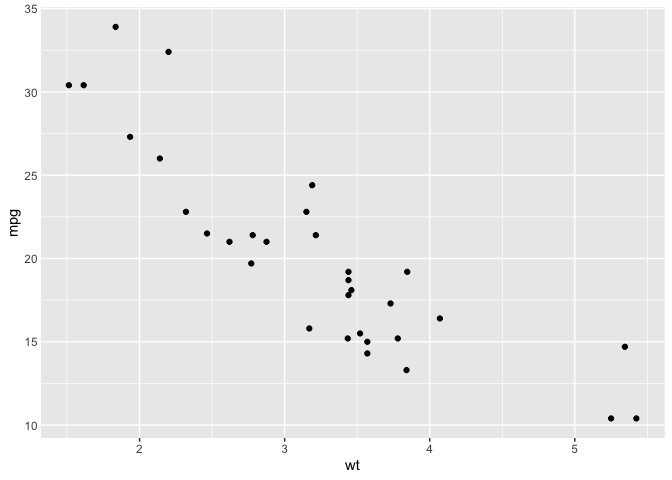
ggplot(mtcars, aes(wt, mpg)) +
  geom_point() +
  easy_remove_x_axis()
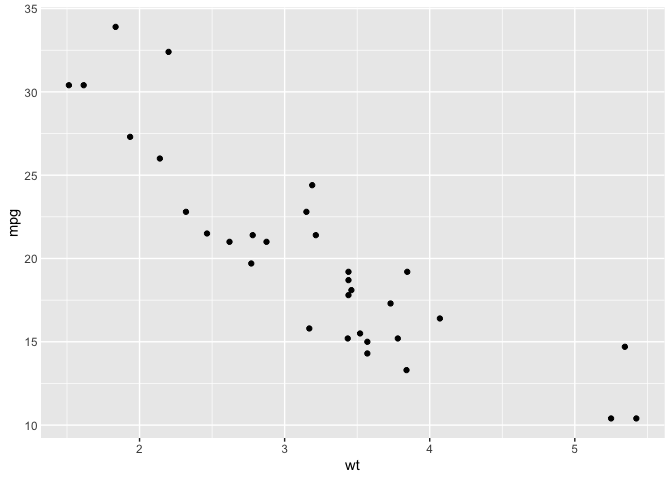
# remove y axis ticks
ggplot(mtcars, aes(wt, mpg)) +
  geom_point() +
  easy_remove_y_axis(what = "ticks")
# move legends to bottom
ggplot(mtcars, aes(wt, mpg, colour = cyl, size = hp)) +
  geom_point() +
  easy_move_legend("bottom")
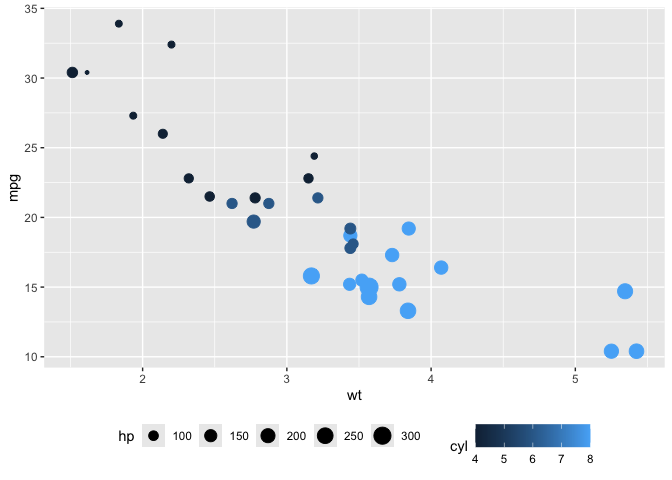
# move legend to left side
ggplot(mtcars, aes(wt, mpg, colour = cyl, size = hp)) +
  geom_point() +
  easy_legend_at("left")
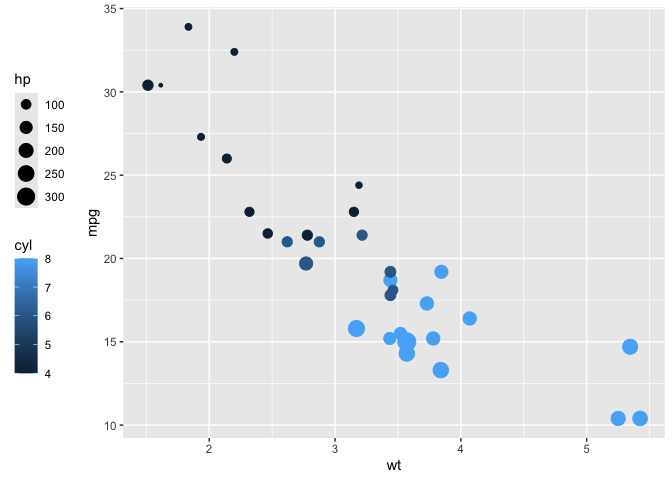
# Make legends horizontal
ggplot(mtcars, aes(wt, mpg, colour = cyl, size = hp)) +
  geom_point() + easy_rotate_legend("horizontal")
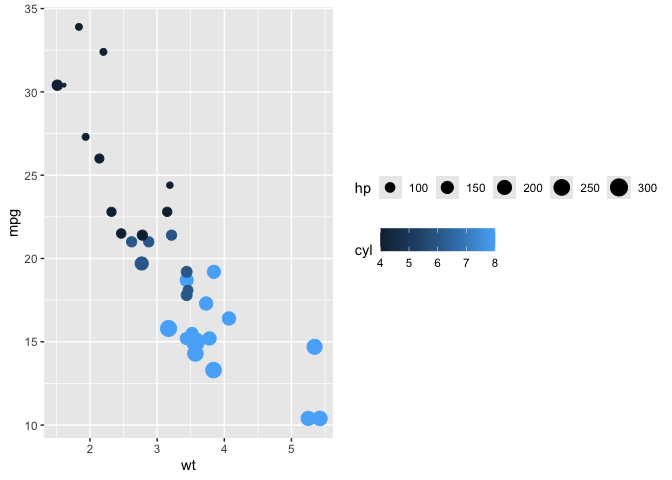
These functions will try to teach you the ‘official’ way to achieve
these goal, usually via the teach argument (where implemented)
ggplot(mtcars, aes(hp, mpg)) +
    geom_point() +
    easy_rotate_y_labels(angle = "startatbottom", teach = TRUE)
#> easy_rotate_y_labels call can be substituted with:
#> theme(axis.text.y = element_text(angle = 90, hjust = 0))
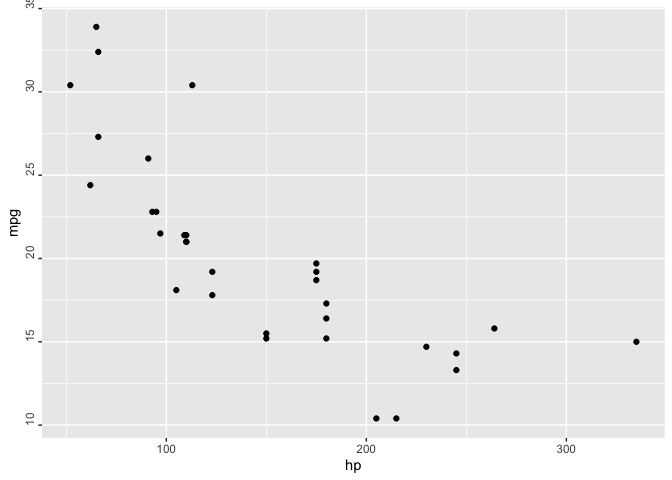
ggplot(mtcars, aes(wt, mpg)) +
  geom_point() +
  easy_remove_y_axis(what = "ticks", teach = TRUE)
#> easy_remove_y_axis call can be substituted with:
#> theme(axis.ticks.y = element_blank())
Credits
Many thanks to Sébastien Rochette (@statnmap) for the design and execution of the hex logo.