funStatTest
Statistical Testing for Functional Data
Implementation of two sample comparison procedures based on
median-based statistical tests for functional data, introduced in
Smida et al (2022)
Statistical Testing for Functional Data
Website and Source code
The funStatTest package implements various statistics for two sample
comparison testing regarding functional data introduced and used in
Smida et al 2022 [1].
This package is developed by:
Installation
To install the funStatTest package, you can run:
install.packages("funStatTest")
You can also install the development version of funStatTest with the
following command:
remotes::install_git("https://plmlab.math.cnrs.fr/gdurif/funStatTest")
Documentation
See the package vignette and function manuals for more details about the package usage.
Development
The funStatTest was developed using the
fusen package [2].
See in the dev sub-directory in the package sources for more
information, in particular:
- the file
dev/dev_history.Rmddescribing the development process - the file
dev/flat_package.Rmddefining the major package functions (from which the vignette is extracted) - the file
dev/flat_internal.Rmddefining package internal functions
The funStatTest website was generated using the
pkgdown package [3].
Example
This is a basic example which shows you how to solve a common problem:
library(funStatTest)
Data simulation
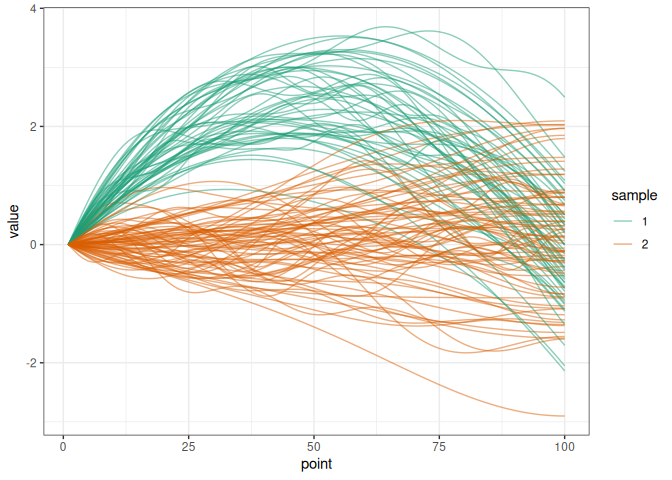
We simulate two samples of trajectories diverging by a delta function.
simu_data <- simul_data(
    n_point = 100, n_obs1 = 50, n_obs2 = 75, c_val = 10,
    delta_shape = "quadratic", distrib = "normal"
)

plot_simu(simu_data)
We extract the matrices of trajectories associated to each sample:
MatX <- simu_data$mat_sample1
MatY <- simu_data$mat_sample2
And we compute the different statistics for two sample function data comparison presented in Smida et al 2022 [1]:
res <- comp_stat(MatX, MatY, stat = c("mo", "med", "wmw", "hkr", "cff"))
res
#> $mo
#> [1] 0.9486241
#>
#> $med
#> [1] 0.9517283
#>
#> $wmw
#> [1] 0.9074959
#>
#> $hkr
#>         [,1]
#> T1 31987.663
#> T2  8489.875
#>
#> $cff
#> [1] 14150.96
We can also compute p-values associated to these statistics:
# small data for the example
simu_data <- simul_data(
    n_point = 20, n_obs1 = 4, n_obs2 = 5, c_val = 10,
    delta_shape = "constant", distrib = "normal"
)

MatX <- simu_data$mat_sample1
MatY <- simu_data$mat_sample2

res <- permut_pval(
    MatX, MatY, n_perm = 200, stat = c("mo", "med", "wmw", "hkr", "cff"),
    verbose = TRUE)
res
#> $mo
#> [1] 0.01492537
#>
#> $med
#> [1] 0.0199005
#>
#> $wmw
#> [1] 0.01492537
#>
#> $hkr
#>          T1          T2
#> 0.014925373 0.009950249
#>
#> $cff
#> [1] 0.009950249
:warning: computing p-values based on permutations may take some time (for large data or when using a large number of simulations. :warning:
And we can also run a simulation-based power analysis:
# simulate a few small data for the example
res <- power_exp(
    n_simu = 20, alpha = 0.05, n_perm = 200,
    stat = c("mo", "med", "wmw", "hkr", "cff"),
    n_point = 25, n_obs1 = 4, n_obs2 = 5, c_val = 10, delta_shape = "constant",
    distrib = "normal", max_iter = 10000, verbose = FALSE
)
res$power_res
#> $mo
#> [1] 1
#>
#> $med
#> [1] 1
#>
#> $wmw
#> [1] 1
#>
#> $hkr
#> T1 T2
#>  1  1
#>
#> $cff
#> [1] 1
References
1. Smida, Z, Cucala, L, Gannoun, A, and Durif, G 2022 A median test for functional data. Journal of Nonparametric Statistics, 34(2): 520–553. DOI: https://doi.org/10.1080/10485252.2022.2064997
2. Rochette, S 2022 Fusen: Build a package from rmarkdown files. URL https://CRAN.R-project.org/package=fusen
3. Wickham, H, Hesselberth, J, and Salmon, M 2022 Pkgdown: Make static HTML documentation for a package. URL https://CRAN.R-project.org/package=pkgdown