fdacluster
Joint Clustering and Alignment of Functional Data
Implementations of the k-means, hierarchical agglomerative and
DBSCAN clustering methods for functional data which allows for jointly
aligning and clustering curves. It supports functional data defined on
one-dimensional domains but possibly evaluating in multivariate codomains.
It supports functional data defined in arrays but also via the 'fd' and
'funData' classes for functional data defined in the 'fda' and 'funData'
packages respectively. It currently supports shift, dilation and affine
warping functions for functional data defined on the real line and uses the
SRVF framework to handle boundary-preserving warping for functional data
defined on a specific interval. Main reference for the k-means algorithm:
Sangalli L.M., Secchi P., Vantini S., Vitelli V. (2010) "k-mean alignment
for curve clustering"
fdacluster 




The fdacluster package
provides implementations of the $k$-means, hierarchical agglomerative
and DBSCAN clustering methods for functional data. Variability in
functional data is intrinsically divided into three components:
amplitude, phase and ancillary variability. The first two sources
of variability can be captured with a dedicated statistical analysis
that integrates a curve alignment step. The $k$-means and HAC
algorithms implemented in
fdacluster provide
clustering structures that are based either on ampltitude variation
(default behavior) or phase variation. This is achieved by jointly
performing clustering and alignment of a functional data set. The three
main related functions are
fdakmeans()
for the $k$-means,
fdahclust()
for HAC and
fdadbscan()
for DBSCAN. The methods handle multivariate codomains.
Installation
You can install the official version from CRAN via:
install.packages("fdacluster")
or you can opt to install the development version from GitHub with:
# install.packages("remotes")
remotes::install_github("astamm/fdacluster")
Example
Data set
Let us consider the following simulated example of $30$ $1$-dimensional
curves: 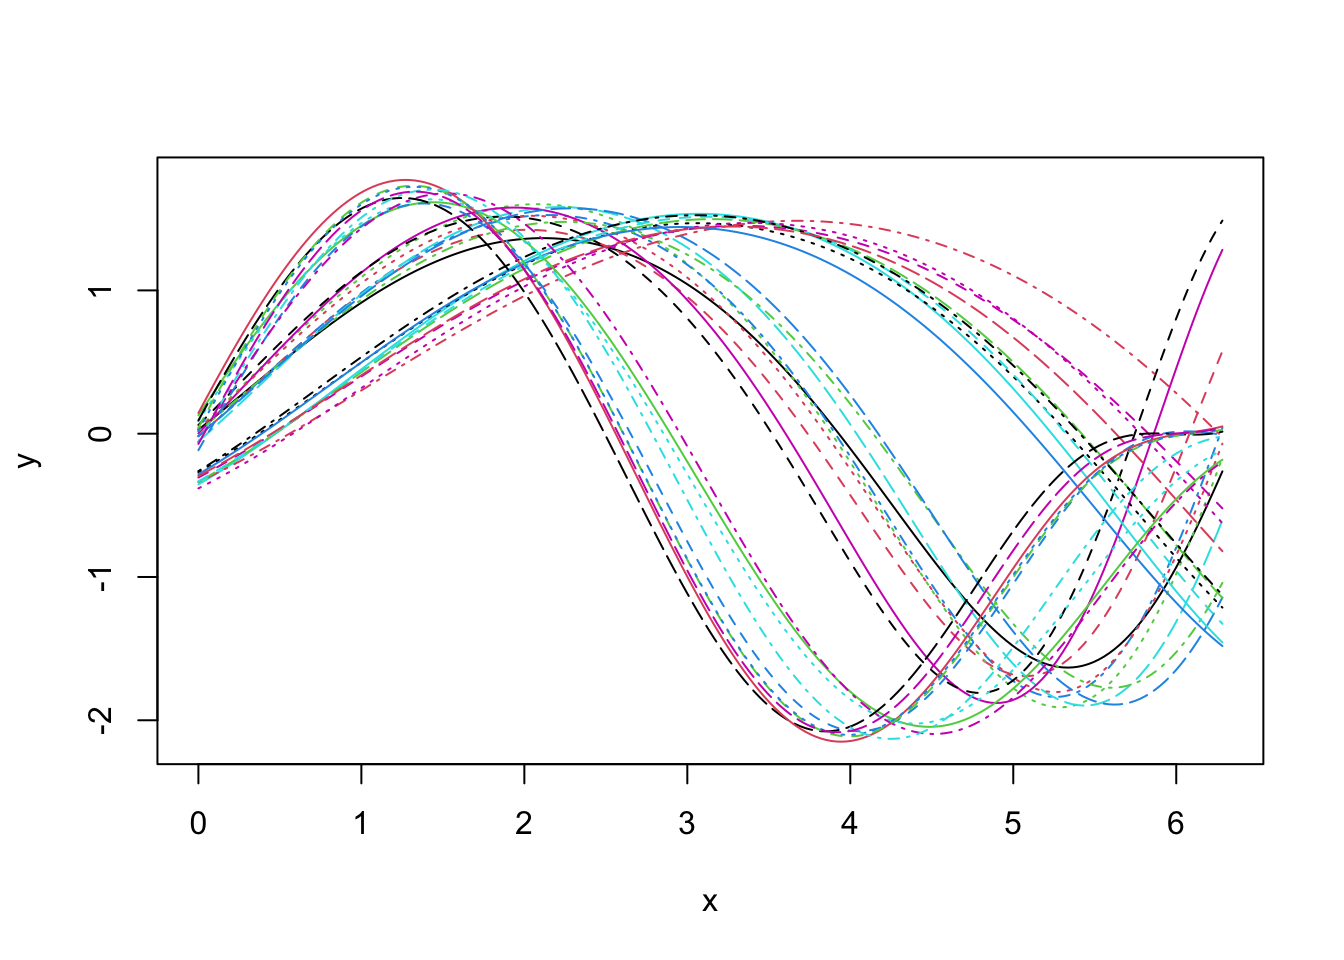
Looking at the data set, it seems that we shall expect $3$ groups if we aim at clustering based on phase variability but probably only $2$ groups if we search for a clustering structure based on amplitude variability.
$k$-means based on amplitude variability
We can perform $k$-means clustering based on amplitude variability as follows:
out1 <- fdakmeans(
  simulated30$x,
  simulated30$y,
  seeds = c(1, 21),
  n_clusters = 2,
  centroid_type = "mean",
  warping_class = "affine",
  metric = "normalized_l2",
  cluster_on_phase = FALSE
)
All of
fdakmeans(),
fdahclust()
and
fdadbscan()
functions returns an object of class
caps (for
Clustering with Amplitude and Phase Separation) for
which S3 specialized methods of
ggplot2::autoplot()
and
graphics::plot()
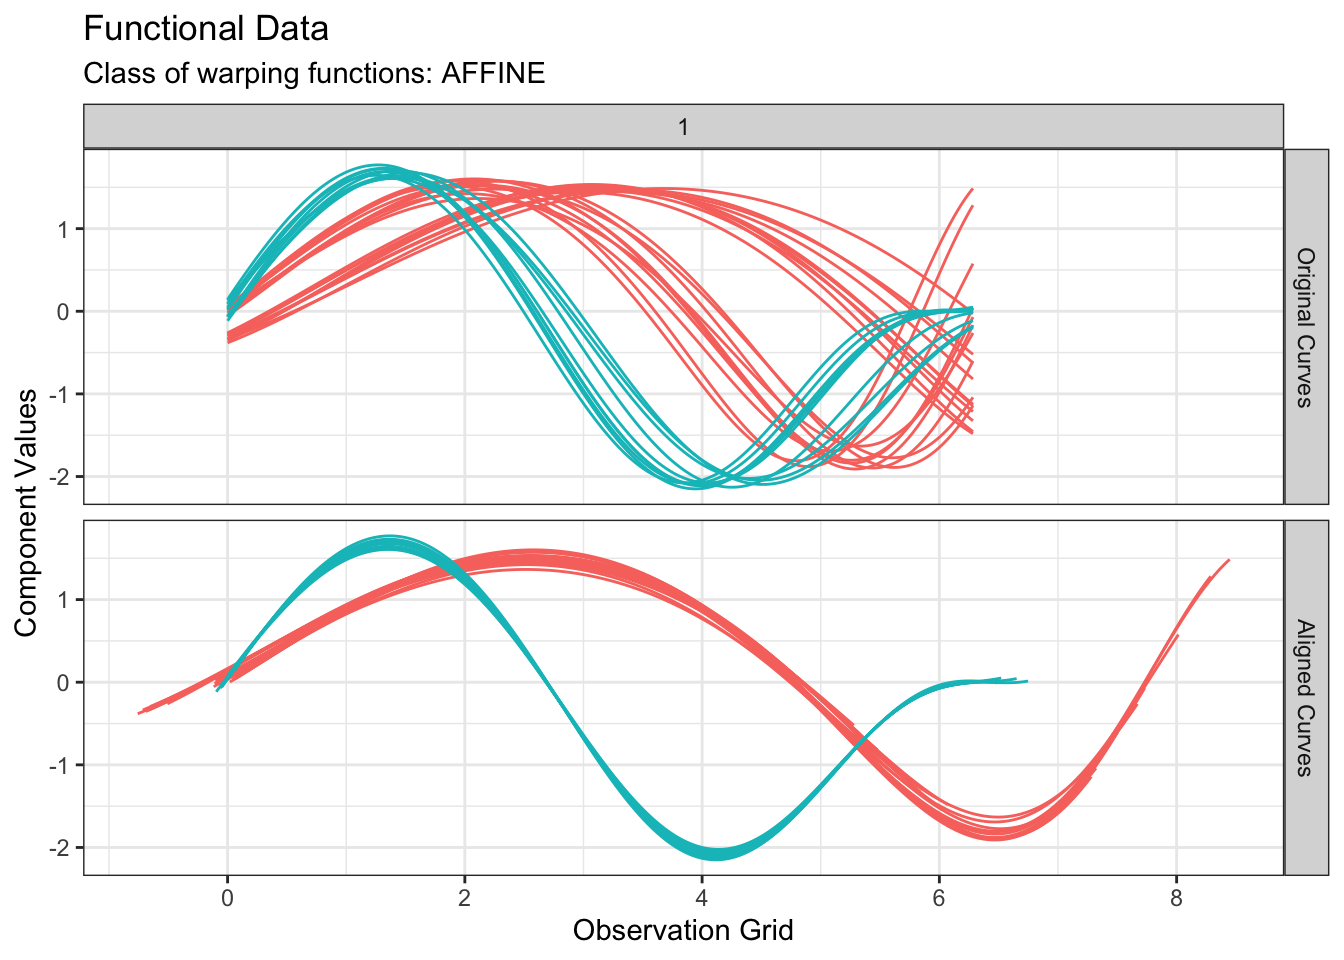
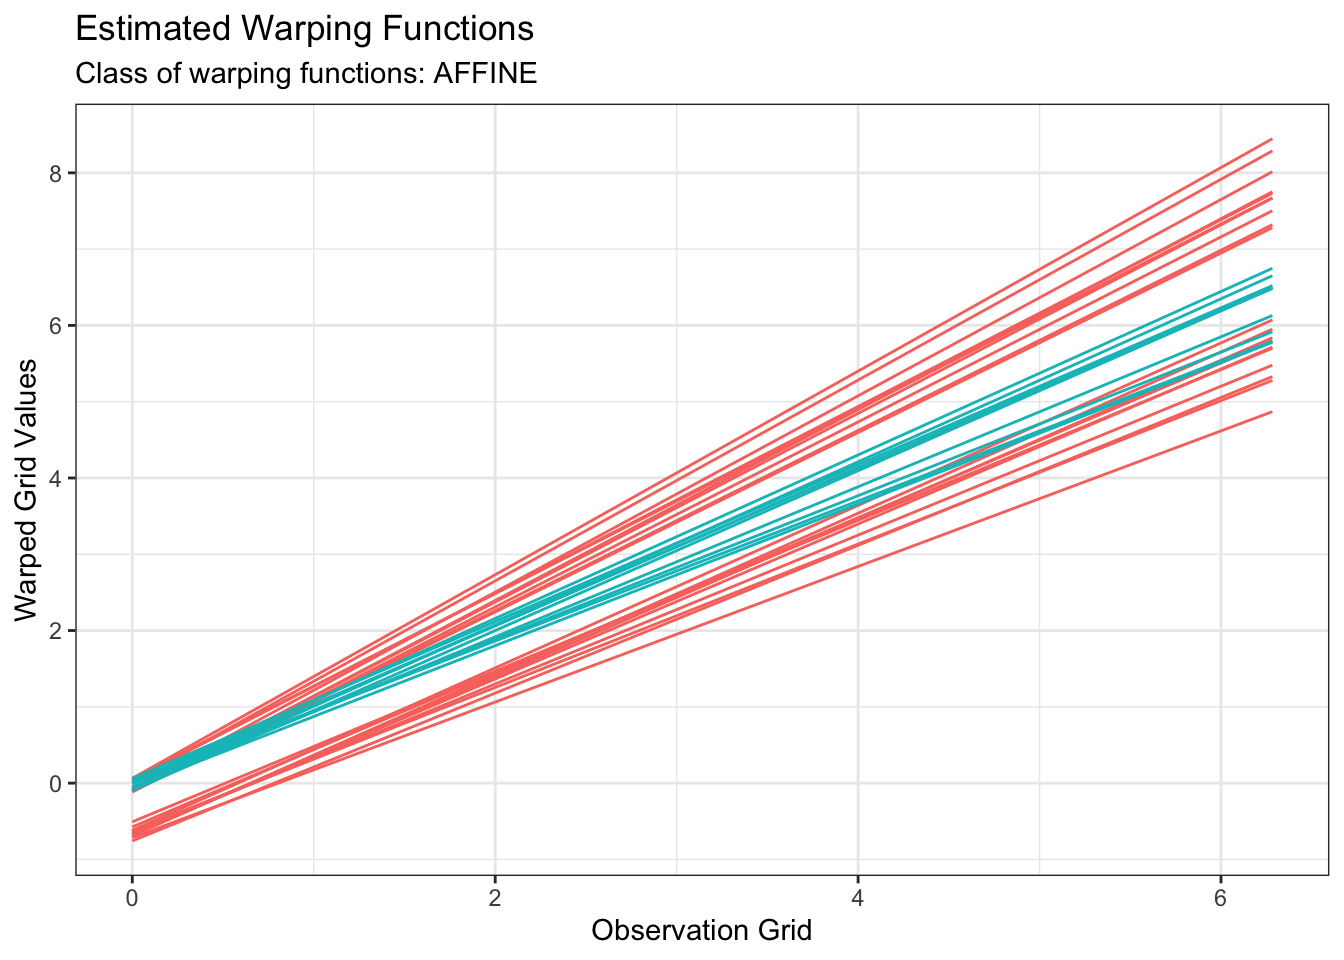
have been implemented. Therefore, we can visualize the results simply
with:
plot(out1, type = "amplitude")
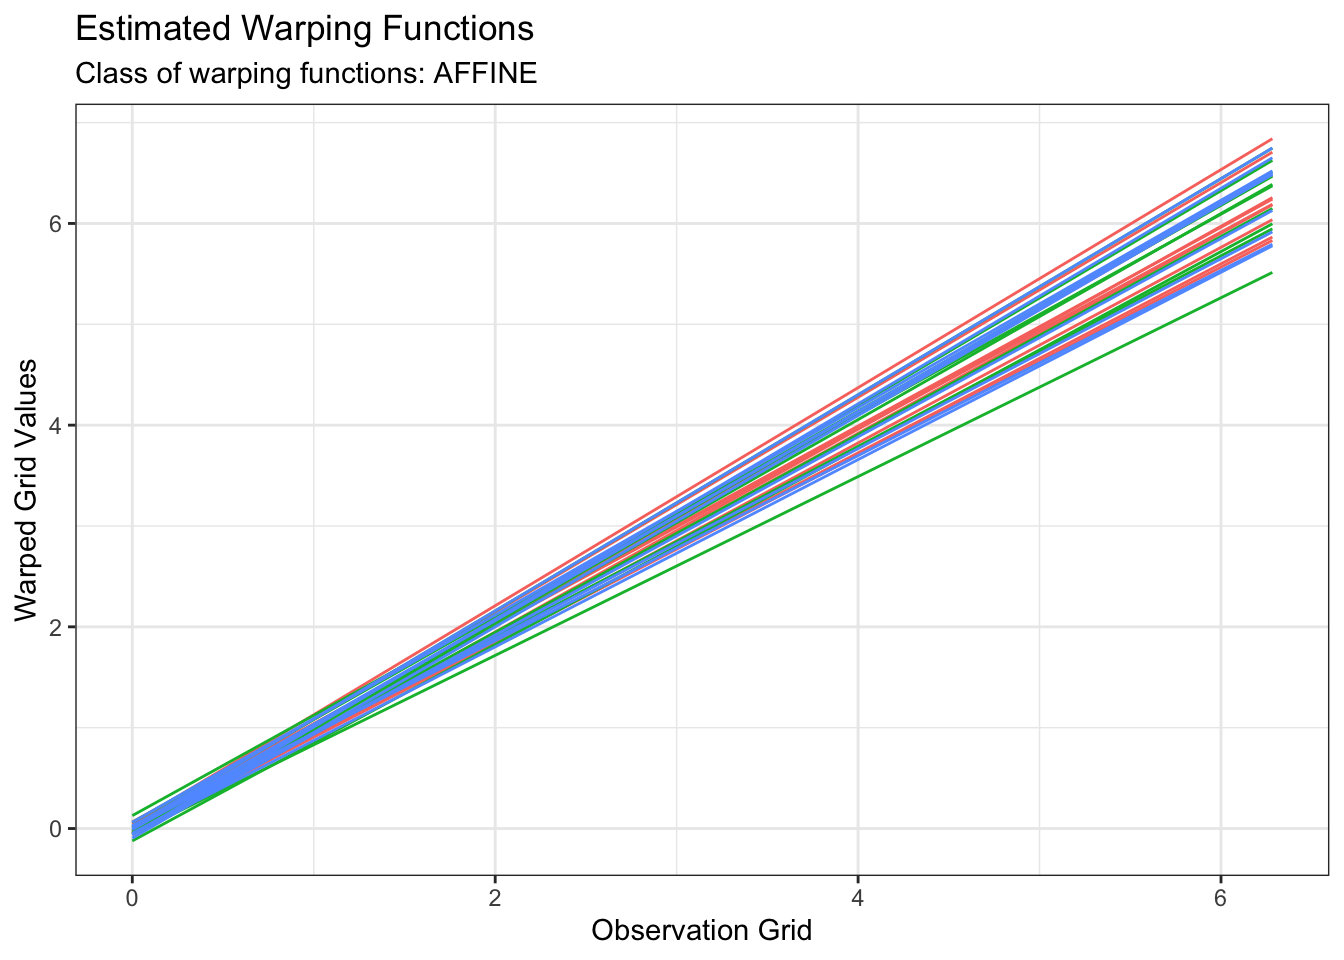
plot(out1, type = "phase")
$k$-means based on phase variability
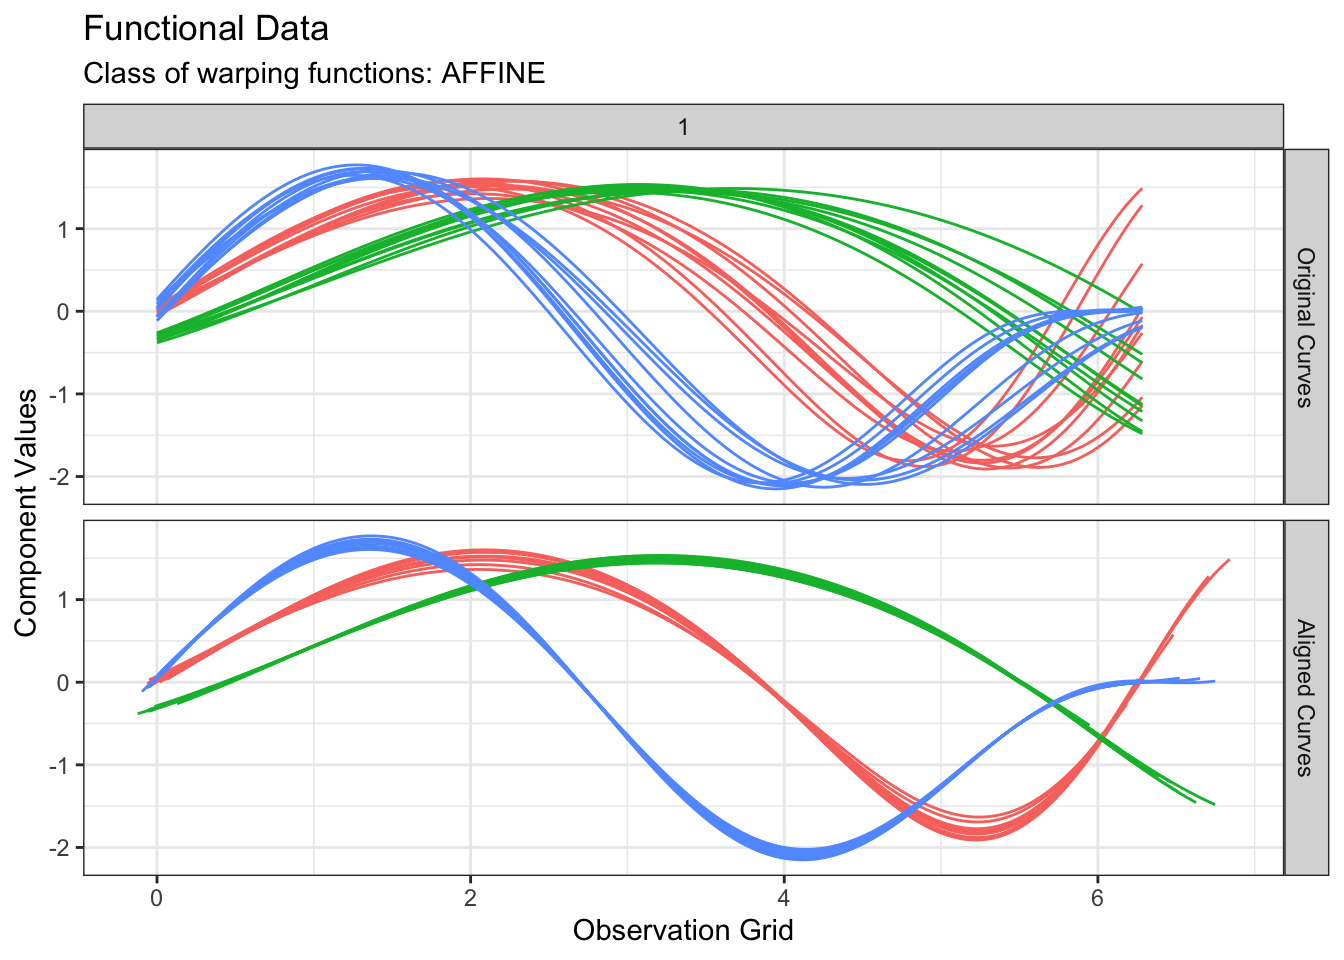
We can perform $k$-means clustering based on phase variability only by
switch the cluster_on_phase argument to TRUE:
out2 <- fdakmeans(
  simulated30$x,
  simulated30$y,
  seeds = c(1, 11, 21),
  n_clusters = 3,
  centroid_type = "mean",
  warping_class = "affine",
  metric = "normalized_l2",
  cluster_on_phase = TRUE
)
We can inspect the result:
plot(out2, type = "amplitude")
plot(out2, type = "phase")
We can perform similar analyses using HAC or DBSCAN instead of
$k$-means. The fdacluster
package also provides visualization tools to help choosing the optimal
number of cluster based on WSS and silhouette values. This can be
achieved by using a combination of the functions
compare_caps()
and
plot.mcaps().