card
Cardiovascular Applications in Research Data
A collection of cardiovascular research datasets and analytical tools, including methods for cardiovascular procedural data, such as electrocardiography, echocardiography, and catheterization data. Additional methods exist for analysis of procedural billing codes.


card
Cardiovascular Applications for Research Data
The inspiration for {card} was to create useful functions and
analytical approaches in computational neurocardiology, with a on
electrocardiography and epidemiology.
The areas of focus of this package are the following:
- handling of recurrent and circadian events
- epidemiological focus on effective model building
Installation
You can install the released version of {card} from
CRAN with:
install.packages("card")
And the development version from GitHub with:
# install.packages("devtools")
devtools::install_github("shah-in-boots/card")
Usage
The intent for card is to assist in the analysis of cardiovascular and
epidemiological data, with a focus on cardiac-specific datasets and data
types.
library(card)
Datasets
- Cardiovascular disease outcomes with recurrent events
- Vectorcardiography data in a high-risk cohort
- Continuous electrocardiography recordings in a clinical cohort with quantitative stress data
# ECG data
data("twins")
head(twins)
#> # A tibble: 6 × 23
#> # Groups:   patid, hour [6]
#>   patid   age   bmi race  smoking hptn  dm    chf   prevchd med_beta_blockers
#>   <dbl> <dbl> <dbl> <fct> <fct>   <fct> <fct> <fct> <fct>   <fct>
#> 1     1    49  27.4 0     1       1     0     0     0       0
#> 2     1    49  27.4 0     1       1     0     0     0       0
#> 3     1    49  27.4 0     1       1     0     0     0       0
#> 4     1    49  27.4 0     1       1     0     0     0       0
#> 5     1    49  27.4 0     1       1     0     0     0       0
#> 6     1    49  27.4 0     1       1     0     0     0       0
#> # ℹ 13 more variables: med_antidepr <fct>, beck_total <dbl>, sad_bin <fct>,
#> #   sad_cat <fct>, PETdiff_2 <fct>, dyxtime <dttm>, date <date>, hour <dbl>,
#> #   rDYX <dbl>, sDYX <dbl>, HR <dbl>, CP <dbl>, zip <chr>

# Outcomes data
data("stress")
head(stress)
#> # A tibble: 6 × 11
#>      id start      stop       head_ache_date_1 head_ache_date_2 head_ache_date_3
#>   <dbl> <date>     <date>     <date>           <date>           <date>
#> 1   123 2014-08-26 2016-12-08 2016-12-08       NA               NA
#> 2   117 2014-08-12 2016-10-30 2016-10-30       NA               NA
#> 3   145 2014-10-22 2016-07-31 2016-06-01       2016-07-31       NA
#> 4   144 2014-10-21 2017-03-24 2015-02-12       NA               NA
#> 5   204 2015-03-16 2015-04-03 NA               NA               NA
#> 6   283 2015-10-12 2016-01-19 NA               NA               NA
#> # ℹ 5 more variables: heart_ache_date_1 <date>, heart_ache_date_2 <date>,
#> #   heart_ache_date_3 <date>, death <dbl>, broken_heart <dbl>

# VCG data
data("geh")
head(geh)
#> # A tibble: 6 × 70
#>      pid hhp_id   age sex   age_cat systolic_bp_first systolic_bp_second
#>    <dbl>  <dbl> <dbl> <fct> <fct>               <dbl>              <dbl>
#> 1 200481 220946    42 0     0                     162                165
#> 2 200489 224643    62 1     1                     133                128
#> 3 200495 224845    84 0     2                     100                 99
#> 4 200052 222917    65 0     2                     139                141
#> 5 200517 220638    64 1     1                     166                163
#> 6 200623 224862    57 0     1                     151                144
#> # ℹ 63 more variables: systolic_bp_third <dbl>, diastolic_bp_first <dbl>,
#> #   diastolic_bp_second <dbl>, diastolic_bp_third <dbl>,
#> #   pulse_rate_first <dbl>, pulse_rate_second <dbl>, height_cm <dbl>,
#> #   weight_kg <dbl>, waist_cm <dbl>, dia_trt_allopdrug <hvn_lbll>,
#> #   hbp_trt_allopdrug <hvn_lbll>, hyp_trt_allopdrug <hvn_lbll>,
#> #   lab_hba1c <dbl>, lab_fasting_bg <dbl>, lab_fasting_insulin <dbl>,
#> #   lab_tchol <dbl>, lab_ldlchol <dbl>, lab_hdlchol <dbl>, lab_triglyc <dbl>, …
Cosinor Analysis
This modeling algorithm requires only base R, which allows internal
flexibility for modeling heuristics and improved efficiency. For the
user, it also allows standard modeling tools/approaches, and a flexible
user interface that accounts for individual/population analysis and
single/multiple component analysis.
There are other cosinor models available in R, however they do not
allow for simple multiple-component or individual/population analysis in
a method that is tidy (for both tidyverse and tidymodels
approaches).
m <- cosinor(rDYX ~ hour, twins, tau = c(24, 12))
summary(m)
#> Individual Cosinor Model
#> ------------------------------------------
#> Call:
#> cosinor(formula = rDYX ~ M + A1 * cos(2*pi*hour/24 + phi1) + A2 * cos(2*pi*hour/12 + phi2)
#>
#> Period(s): 24, 12
#>
#> Residuals:
#>     Min.  1st Qu.   Median     Mean  3rd Qu.     Max.
#> -3.00770 -0.52024 -0.03247  0.00000  0.48753  4.88552
#>
#> Coefficients:
#>         Estimate  Std. Error
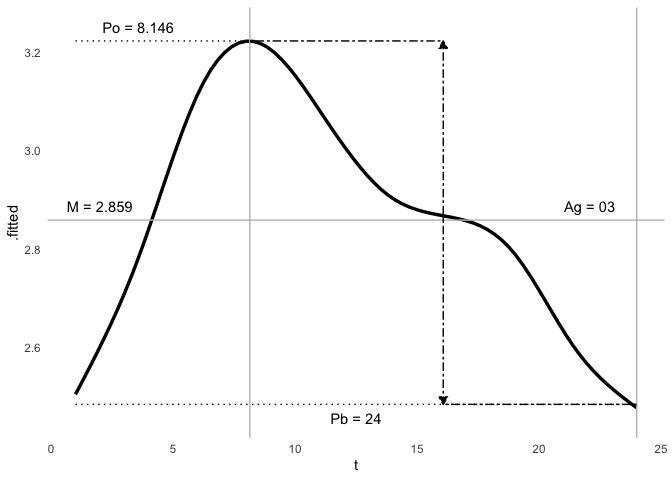
#> mesor  2.8586510 0.006062639
#> amp1   0.2964114 0.008702368
#> amp2   0.1302012 0.008542526
#> phi1  -2.6542757 0.028911445
#> phi2  -3.6636921 0.065235427
ggcosinor(m)
#> This is a harmonic multiple-component cosinor object. The orthophase, bathyphase, and global amplitude were calculated.
#> Warning in regularize.values(x, y, ties, missing(ties)): collapsing to unique
#> 'x' values
#> `geom_smooth()` using formula = 'y ~ s(x, bs = "cs")'
head(augment(m))
#> # A tibble: 6 × 8
#>       y     t     x1        x2        z1        z2 .fitted .resid
#>   <dbl> <dbl>  <dbl>     <dbl>     <dbl>     <dbl>   <dbl>  <dbl>
#> 1  2.63     8 -0.5   -5.00e- 1  8.66e- 1 -8.66e- 1    3.22 -0.592
#> 2  2.42     9 -0.707 -1.84e-16  7.07e- 1 -1   e+ 0    3.21 -0.787
#> 3  1.81    10 -0.866  5   e- 1  5   e- 1 -8.66e- 1    3.15 -1.34
#> 4  2.01    11 -0.966  8.66e- 1  2.59e- 1 -5.00e- 1    3.08 -1.07
#> 5  1.63    12 -1      1   e+ 0  1.22e-16 -2.45e-16    3.01 -1.38
#> 6  1.95    13 -0.966  8.66e- 1 -2.59e- 1  5   e- 1    2.95 -0.996