barrel
Covariance-Based Ellipses and Annotation Tools for Ordination Plots
Provides tools to visualize ordination results in 'R' by adding covariance-based ellipses, centroids, vectors, and confidence regions to plots created with 'ggplot2'.
The package extends the 'vegan' framework and supports Principal Component Analysis (PCA), Redundancy Analysis (RDA), and Non-metric Multidimensional Scaling (NMDS).
Ellipses can represent either group dispersion (standard deviation, SD) or centroid precision (standard error, SE), following Wang et al. (2015)
barrel: Ordination visualization in R
barrel 
A tidy and flexible framework for visualizing multivariate ordinations in R


Overview
barrel is an R package that enhances the visualization of ordination
analyses (e.g. NMDS, RDA, dbRDA) using ggplot2. It provides a modular
set of tools to add ellipses, centroids, environmental vectors, and
annotations — all compatible with tidyverse workflows.
Installation
From CRAN:
install.packages("barrel")
Development version from GitHub:
# install.packages("devtools")
devtools::install_github("BarrancoElena/barrel")
Quick example
library(vegan)
library(barrel)
library(ggplot2)

data(dune)
data(dune.env)

ord <- metaMDS(dune)
ord <- barrel_prepare(ord, dune.env)

autoplot(ord, group = "Management", data = dune)
# barrel 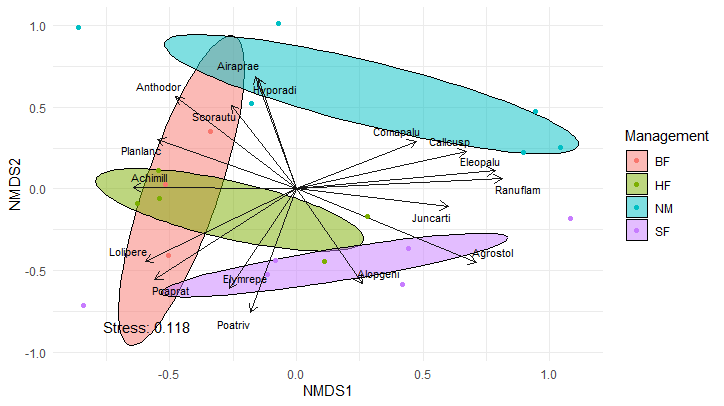
Key features
autoplot(): single-function plotting of NMDS, RDA, dbRDA, CCA, etc.- Support for
method = "classic"and"robust"covariance estimation - Ellipses (
stat_barrel()), centroids (stat_barrel_centroid()), vectors (stat_barrel_arrows()) - Annotated variance or stress via
stat_barrel_annotate() - Functions to extract group summaries and environmental fits
- Customizable with standard
ggplot2syntax
Vignette
A full user guide is available:
browseVignettes("barrel")
Dependencies
Author
Diego Barranco-Elena
@BarrancoElena
License
MIT © 2025 Diego Barranco-Elena