RplotterPkg
R Plotting Functions Using 'ggplot2'
Makes it easy to produce everyday 'ggplot2' charts in a functional way without an extensive "tree" implementation. The package includes over 15 functions for the production and arrangement of basic graphing.
RplotterPkg
The goal of RplotterPkg is to provide easy access to the many ggplot2
geom plotting routines for everyday use. The package uses a functional
approach along with the fast, efficient data frame processing from
data.table.
Installation
The package is available for installation from CRAN.
You can install the development version of RplotterPkg from GitHub with:
Using pak::pak():
pak::pak("deandevl/RplotterPkg")
Using devtools::install_github():
devtools::install_github("deandevl/RplotterPkg")
Examples
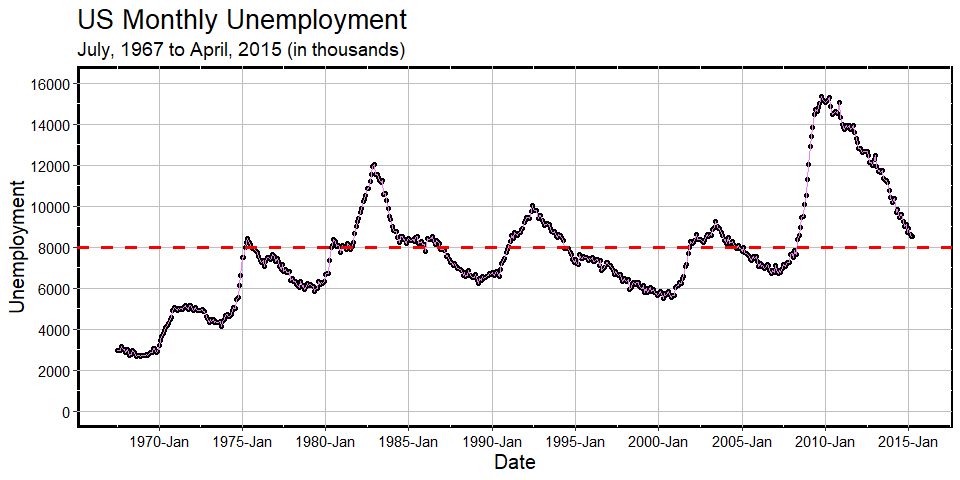
The following script shows how simple it is to create a standard scatter plot. Other standard plots include bar, box, density, density_ridge, histogram, range, heatmap, and stick plots.
Other functions for plots are available including multi_panel, spread_level, stem_leaf, and symmetry.
Additional examples showing heatmap, waffle, and stem_leaf are available here.
library(ggplot2)
library(RplotterPkg)
#> Warning: package 'RplotterPkg' was built under R version 4.4.3

RplotterPkg::create_scatter_plot(
    df = ggplot2::economics,
    aes_x = "date",
    aes_y = "unemploy",
    pts_shape = 21,
    pts_fill = "black",
    line_color = "violet",
    connect = TRUE,
    title = "US Monthly Unemployment",
    subtitle = "July, 1967 to April, 2015 (in thousands)",
    x_title = "Date",
    y_title = "Unemployment",
    rot_y_tic_label = TRUE,
    x_date_labels = "%Y-%b",
    x_major_date_breaks = "5 year",
    y_limits = c(0, 16000),
    y_major_breaks = seq(0, 16000, 2000),
    show_minor_grids = F,
    bold_y = 8000,
    bold_y_color = "red",
    bold_y_linetype = "dashed"
  )