ycevo
Nonparametric Estimation of the Yield Curve Evolution
Nonparametric estimation of discount functions and yield curves from
transaction data of coupon paying bonds.
Koo, B., La Vecchia, D., & Linton, O. B. (2021)
ycevo


The goal of ycevo is to provide means for the non-parametric
estimation of the discount function and yield curve of bonds.
If you use any data or code from the ycevo package CRAN release in a
publication, please use the following citation:
Bonsoo Koo, and Yangzhuoran Fin Yang (2025). ycevo: Non-Parametric Estimation of the Yield Curve Evolution. R package version 0.3.0. https://CRAN.R-project.org/package=ycevo.
The package provides code used in Koo, La Vecchia, & Linton (2021). Please use the following citation if you use any result from the paper.
Koo, B., La Vecchia, D., & Linton, O. (2021). Estimation of a nonparametric model for bond prices from cross-section and time series information. Journal of Econometrics, 220(2), 562-588.
Development cycle
The package is in active development and it have been experiencing substantial changes. Since the existing forks have remained inactive for several years, significant modifications have been implemented through rebase. It is advisable for any existing forks to undergo the rebase process.
git remote add upstream https://github.com/bonsook/ycevo.git
git fetch upstream
git rebase upstream/master
git push origin master --force
Installation
You can install the released version of ycevo from CRAN with:
install.packages("ycevo")
You can install the development version from GitHub with:
# install.packages("devtools")
devtools::install_github("bonsook/ycevo")
Usage
library(ycevo)
library(lubridate)
#>
#> Attaching package: 'lubridate'
#> The following objects are masked from 'package:base':
#>
#>     date, intersect, setdiff, union

## Simulate
set.seed(1)
bonds <- ycevo_data()
bonds
#> # A tibble: 388,795 × 5
#>    qdate      id              price  tupq  pdint
#>    <date>     <fct>           <dbl> <dbl>  <dbl>
#>  1 2023-01-02 20230106.106643  103.     4 103.
#>  2 2023-01-02 20230721.107768  106.    19   3.88
#>  3 2023-01-02 20230721.107768  106.   200 104.
#>  4 2023-01-02 20240203.106386  106.    32   3.19
#>  5 2023-01-02 20240203.106386  106.   213   3.19
#>  6 2023-01-02 20240203.106386  106.   397 103.
#>  7 2023-01-02 20240817.109392  113.    46   4.70
#>  8 2023-01-02 20240817.109392  113.   227   4.70
#>  9 2023-01-02 20240817.109392  113.   411   4.70
#> 10 2023-01-02 20240817.109392  113.   593 105.
#> # ℹ 388,785 more rows
## Estimate at specified time points
x <- seq(ymd("2023-03-01"), ymd("2023-08-01"), by = "1 month")
res <- ycevo(bonds, x)
## Supports parallel processing and progress bar
# future::plan(future::multisession)
# res <- progressr::with_progress(ycevo(bonds, x))
res
#> # A tibble: 6 × 2
#>   qdate      .est
#> * <date>     <list>
#> 1 2023-03-01 <tibble [73 × 3]>
#> 2 2023-04-01 <tibble [73 × 3]>
#> 3 2023-05-01 <tibble [73 × 3]>
#> 4 2023-06-01 <tibble [73 × 3]>
#> 5 2023-07-01 <tibble [73 × 3]>
#> 6 2023-08-01 <tibble [73 × 3]>
## Predict
augment(res)
#> # A tibble: 438 × 4
#>    qdate         tau .discount .yield
#>    <date>      <dbl>     <dbl>  <dbl>
#>  1 2023-03-01 0.0822     0.986 0.169
#>  2 2023-03-01 0.164      0.985 0.0912
#>  3 2023-03-01 0.247      0.984 0.0654
#>  4 2023-03-01 0.329      0.983 0.0528
#>  5 2023-03-01 0.411      0.982 0.0454
#>  6 2023-03-01 0.493      0.980 0.0407
#>  7 2023-03-01 0.658      0.977 0.0351
#>  8 2023-03-01 0.822      0.974 0.0321
#>  9 2023-03-01 0.986      0.970 0.0305
#> 10 2023-03-01 1.15       0.967 0.0296
#> # ℹ 428 more rows

## Plot
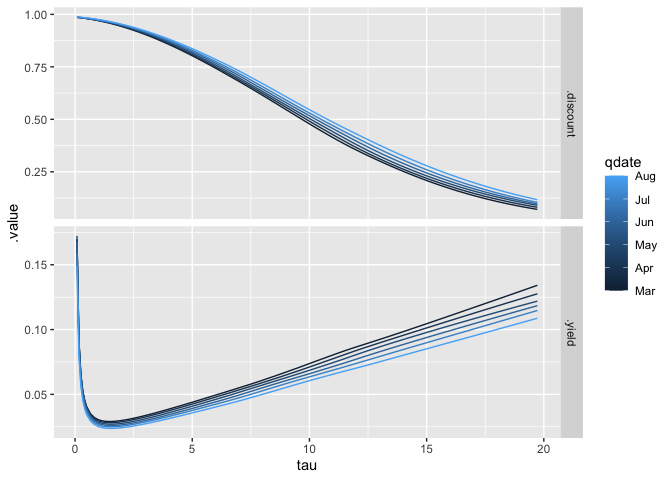
autoplot(res)
## Compare to the true yield curve
curve_true <- list()
for (i in seq_along(x)) {
  curve_true[[i]] <- tibble(
    tau = 1:20,
    qdate = x[[i]],
    .yield = get_yield_at((x[[i]] - ymd("2023-01-01")) / 365, tau),
    .discount = exp(-tau * .yield)
  )
}
curve_true <- bind_rows(curve_true)
curve_true <- pivot_longer(
  curve_true,
  c(.discount, .yield),
  names_to = ".est",
  values_to = ".value"
)

autoplot(res) +
  geom_line(data = curve_true, linetype = "dashed")
License
This package is free and open source software, licensed under GPL-3