vistributions
Visualize Probability Distributions
Visualize and compute percentiles/probabilities of normal, t, f, chi square and binomial distributions.
vistributions
Visualize probability distributions


Installation
# Install release version from CRAN
install.packages("vistributions")

# Install development version from GitHub
# install.packages("devtools")
devtools::install_github("rsquaredacademy/vistributions")
Articles
Usage
Normal Distribution
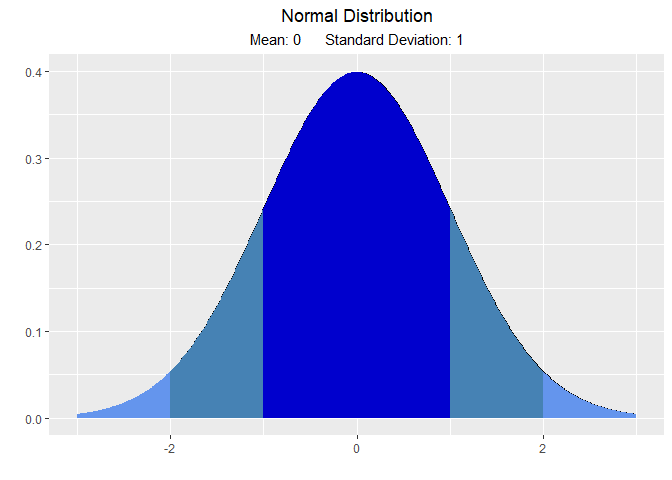
# visualize normal distribution
vdist_normal_plot()
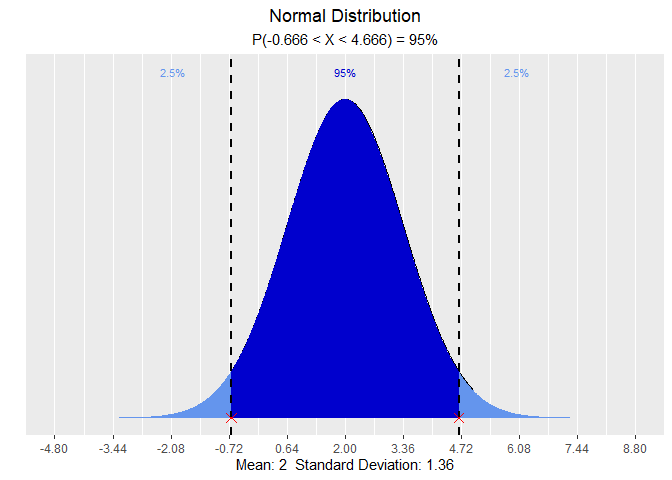
# visualize quantiles out of given probability
vdist_normal_perc(0.95, mean = 2, sd = 1.36, type = 'both')
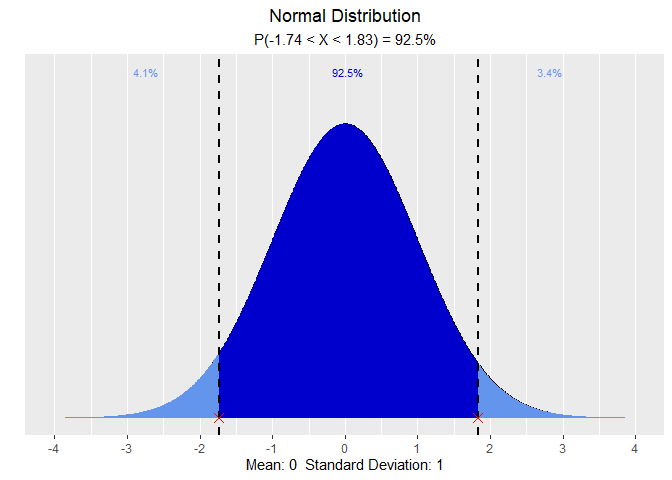
# visualize probability from a given quantile
vdist_normal_prob(c(-1.74, 1.83), type = 'both')
Getting Help
If you encounter a bug, please file a minimal reproducible example using reprex on github. For questions and clarifications, use StackOverflow.