tsviz
Easy and Interactive Time Series Visualization
An 'RStudio' add-in to visualize time series. Time series are searched in the global environment as data.frame objects with a column of type date and a column of type numeric. Interactive charts are produced using 'plotly' package.
tsviz


An RStudio addin to provide easy and interactive time series visualization. To be visible to the addin, time series must be stored in a dataframe in the global environment, with:
- at least a column of type Date
- at least a column of type numeric
Installation
You can install the released version of tsviz from CRAN with:
install.packages("tsviz")
Or install the development version from Github:
devtools::install_github("donlelef/tsviz")
Once you have installed the package, you do not need to load it with
library(), the addins are installed on your machine as part of the
package install process.
Example
First, let us load some suitable data:
library(tsviz)
prices <- crypto_prices
Then, we can run the addin:
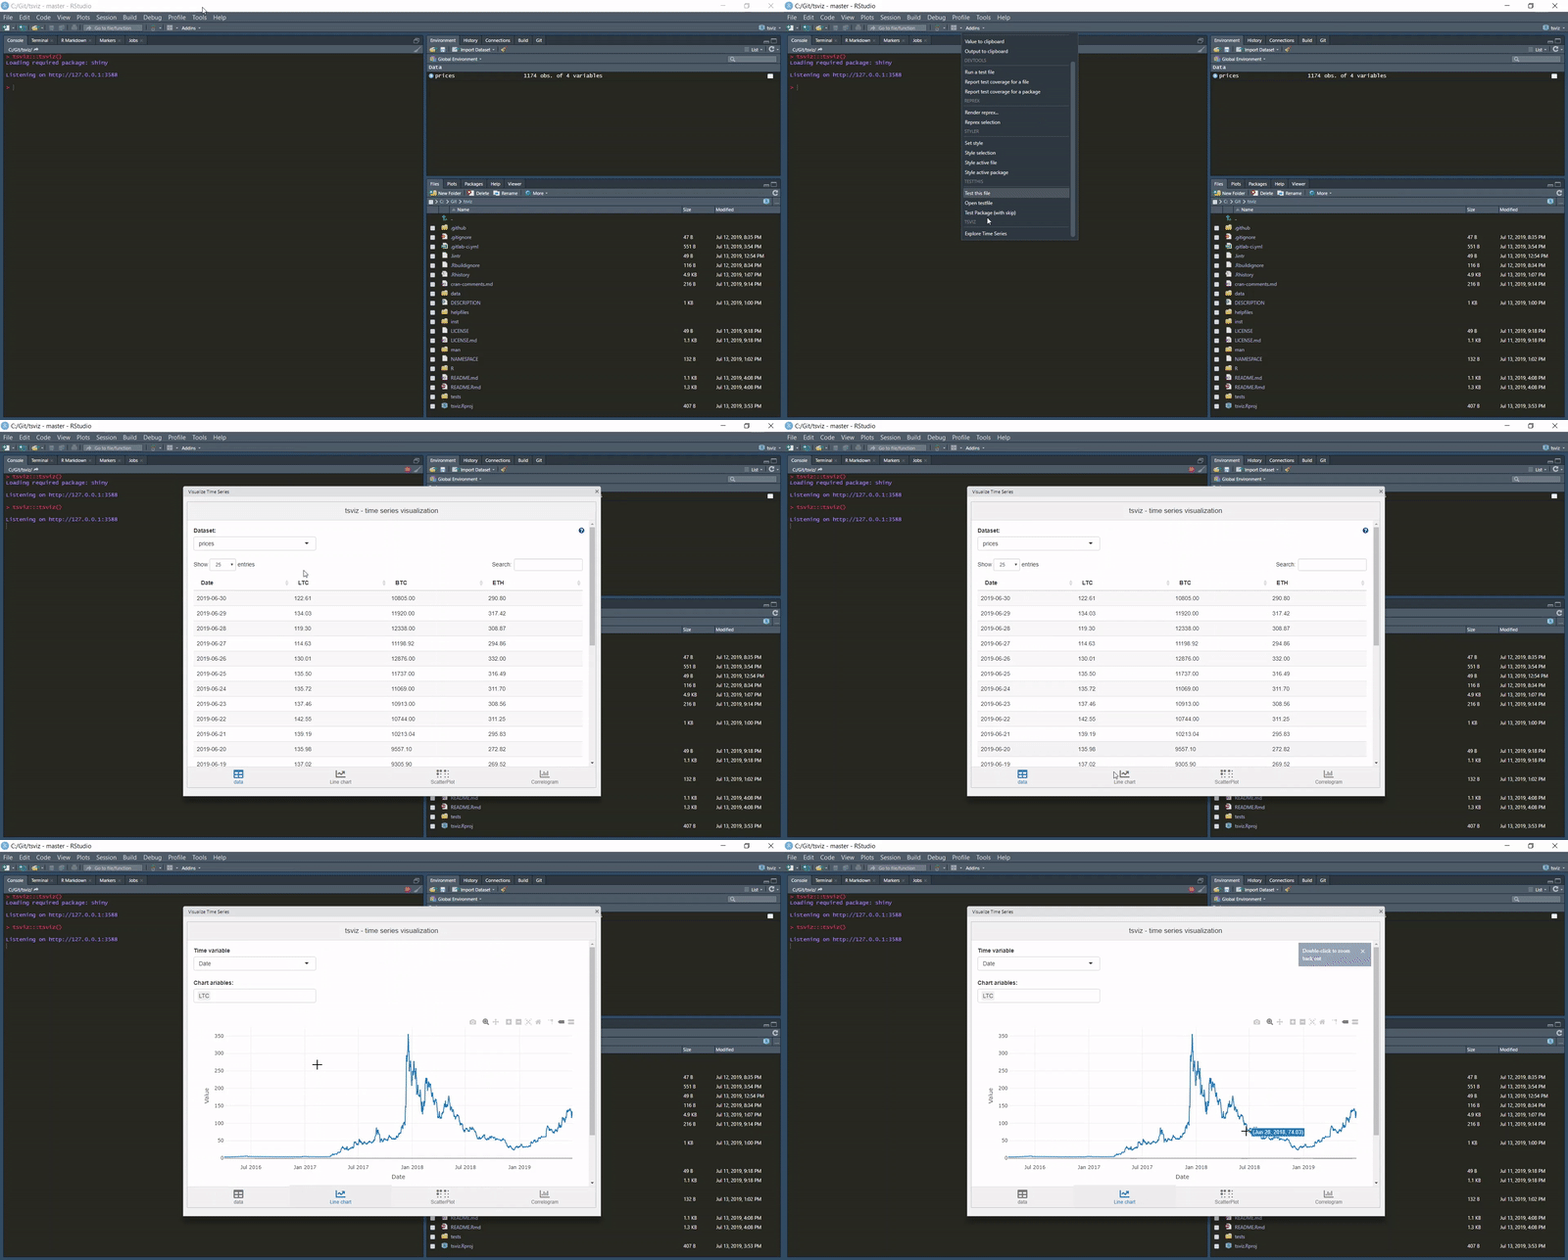
That’s it.