triptych
Diagnostic Graphics to Evaluate Forecast Performance
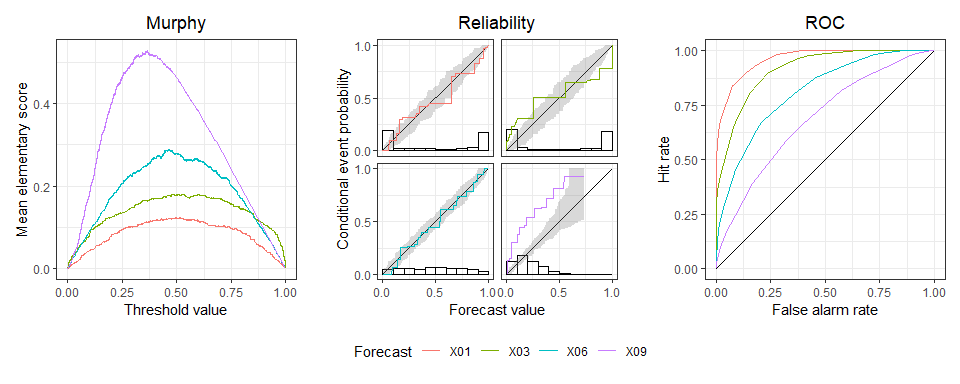
Overall predictive performance is measured by a mean score
(or loss), which decomposes into miscalibration, discrimination, and
uncertainty components. The main focus is visualization of these distinct
and complementary aspects in joint displays.
See Dimitriadis, Gneiting, Jordan, Vogel (2024)
triptych : Diagnostic Graphics to Evaluate Forecast Performance

Overall predictive performance is measured by a mean score (or loss), which decomposes into miscalibration, discrimination, and uncertainty components. The main focus is visualization of these distinct and complementary aspects in joint displays. See Dimitriadis, Gneiting, Jordan, Vogel (2024) doi:10.1016/j.ijforecast.2023.09.007.
Installation
Install the latest release of triptych from CRAN with:
install.packages("triptych")
Install the development version of triptych with:
# install.packages("devtools")
devtools::install_github("aijordan/triptych")
Example
library(triptych)
data(ex_binary, package = "triptych")
set.seed(20230921)

tr <- triptych(ex_binary)
tr
#> # A tibble: 10 × 5
#>    forecast          murphy     reliability             roc          mcbdsc
#>    <chr>         <trpt_mur>      <trpt_rel>      <trpt_roc>   <trpt_mcbdsc>
#>  1 X01      <named list[3]> <named list[3]> <named list[3]> <named list[3]>
#>  2 X02      <named list[3]> <named list[3]> <named list[3]> <named list[3]>
#>  3 X03      <named list[3]> <named list[3]> <named list[3]> <named list[3]>
#>  4 X04      <named list[3]> <named list[3]> <named list[3]> <named list[3]>
#>  5 X05      <named list[3]> <named list[3]> <named list[3]> <named list[3]>
#>  6 X06      <named list[3]> <named list[3]> <named list[3]> <named list[3]>
#>  7 X07      <named list[3]> <named list[3]> <named list[3]> <named list[3]>
#>  8 X08      <named list[3]> <named list[3]> <named list[3]> <named list[3]>
#>  9 X09      <named list[3]> <named list[3]> <named list[3]> <named list[3]>
#> 10 X10      <named list[3]> <named list[3]> <named list[3]> <named list[3]>

# 1. Choose 4 predictions
# 2. Add consistency bands (for reliability curves)
# 3. Create patchwork object
# 4. Adjust the title of the legend
dplyr::slice(tr, 1, 3, 6, 9) |>
  add_consistency(level = 0.9, n_boot = 100) |>
  autoplot() &
  ggplot2::guides(colour = ggplot2::guide_legend("Forecast"))
# From existing triptych object
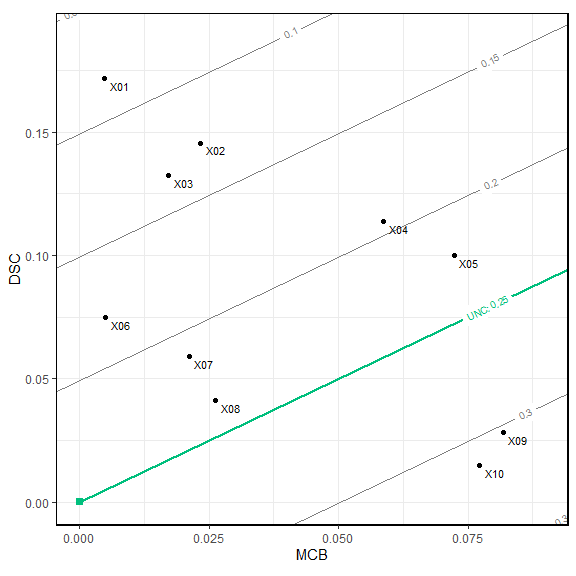
estimates(tr$mcbdsc)
#> # A tibble: 10 × 5
#>    forecast mean_score     MCB    DSC   UNC
#>    <chr>         <dbl>   <dbl>  <dbl> <dbl>
#>  1 X01          0.0827 0.00474 0.172  0.250
#>  2 X02          0.127  0.0233  0.146  0.250
#>  3 X03          0.134  0.0172  0.132  0.250
#>  4 X04          0.194  0.0587  0.114  0.250
#>  5 X05          0.222  0.0723  0.100  0.250
#>  6 X06          0.180  0.00494 0.0748 0.250
#>  7 X07          0.212  0.0211  0.0590 0.250
#>  8 X08          0.235  0.0263  0.0410 0.250
#>  9 X09          0.303  0.0818  0.0282 0.250
#> 10 X10          0.312  0.0772  0.0148 0.250
autoplot(tr$mcbdsc)
# Or standalone:
# mcbdsc(ex_binary) |> estimates()
# mcbdsc(ex_binary) |> autoplot()