tidyaudit
Pipeline Audit Trails and Data Diagnostics for 'tidyverse' Workflows
Provides pipeline audit trails and data diagnostics for 'tidyverse' workflows. The audit trail system captures lightweight metadata snapshots at each step of a pipeline, building a structured record without storing the data itself. Operation-aware taps enrich snapshots with join match rates and filter drop statistics. Trails can be serialized to 'JSON' or 'RDS' and exported as self-contained 'HTML' visualizations. Also includes diagnostic functions for interactive data analysis including frequency tables, string quality auditing, and data comparison.
tidyaudit



Pipeline audit trails and data diagnostics for tidyverse workflows
Audit trails track what happens at every step of a dplyr pipeline by
recording metadata-only snapshots: row counts, column changes, NA totals,
numeric shifts, and custom functions. Build a trail by dropping taps
into your pipe — transparent pass-throughs that record a snapshot and let the
data flow on unchanged. Operation-aware taps, such as left_join_tap() and filter_tap() go
further, capturing match rates and drop counts. The result is a
structured trail you can print, diff, export as HTML, or serialize to JSON. You
can learn more in vignette("tidyaudit").
tidyaudit also includes a diagnostic toolkit for interactive data
exploration — join validation, key checks, table comparison, and more —
described in vignette("diagnostics").
Quick start
library(tidyaudit)
library(dplyr)
set.seed(123)

orders  <- data.frame(id = 1:100, amount = runif(100, 10, 500), region_id = sample(1:5, 100, TRUE))
regions <- data.frame(region_id = 1:4, name = c("North", "South", "East", "West"))

trail <- audit_trail("order_pipeline")

result <- orders |>
  audit_tap(trail, "raw") |>
  left_join_tap(regions, by = "region_id", .trail = trail, .label = "with_region") |>
  filter_tap(amount > 100, .trail = trail, .label = "high_value", .stat = amount)
#> i filter_tap: amount > 100
#> Dropped 18 of 100 rows (18.0%)
#> Stat amount: dropped 1,062.191 of 25,429.39

print(trail)
#> -- Audit Trail: "order_pipeline" -----------------------------------------------
#> Created: 2026-02-21 14:36:35
#> Snapshots: 3
#>
#>   #  Label        Rows  Cols  NAs  Type
#>   -  -----------  ----  ----  ---  ------------------------------------
#>   1  raw           100     3    0  tap
#>   2  with_region   100     4   23  left_join (many-to-one, 77% matched)
#>   3  high_value     82     4   20  filter (dropped 18 rows, 18%)
#>
#> Changes:
#>   raw -> with_region: = rows, +1 cols, +23 NAs
#>   with_region -> high_value: -18 rows, = cols, -3 NAs

audit_diff(trail, "raw", "high_value")
#> -- Audit Diff: "raw" -> "high_value" --
#>
#>   Metric  Before  After  Delta
#>   ------  ------  -----  -----
#>   Rows       100     82    -18
#>   Cols         3      4     +1
#>   NAs          0     20    +20
#>
#> Columns added: name
#>
#> Numeric shifts (common columns):
#>     Column     Mean before  Mean after   Shift
#>     ---------  -----------  ----------  ------
#>     id               50.50       49.66   -0.84
#>     amount          254.29      297.16  +42.87
#>     region_id         3.08        3.05   -0.03
Three taps. Three snapshots. A complete record of what the pipeline did to your data — and what it cost.
Export as HTML
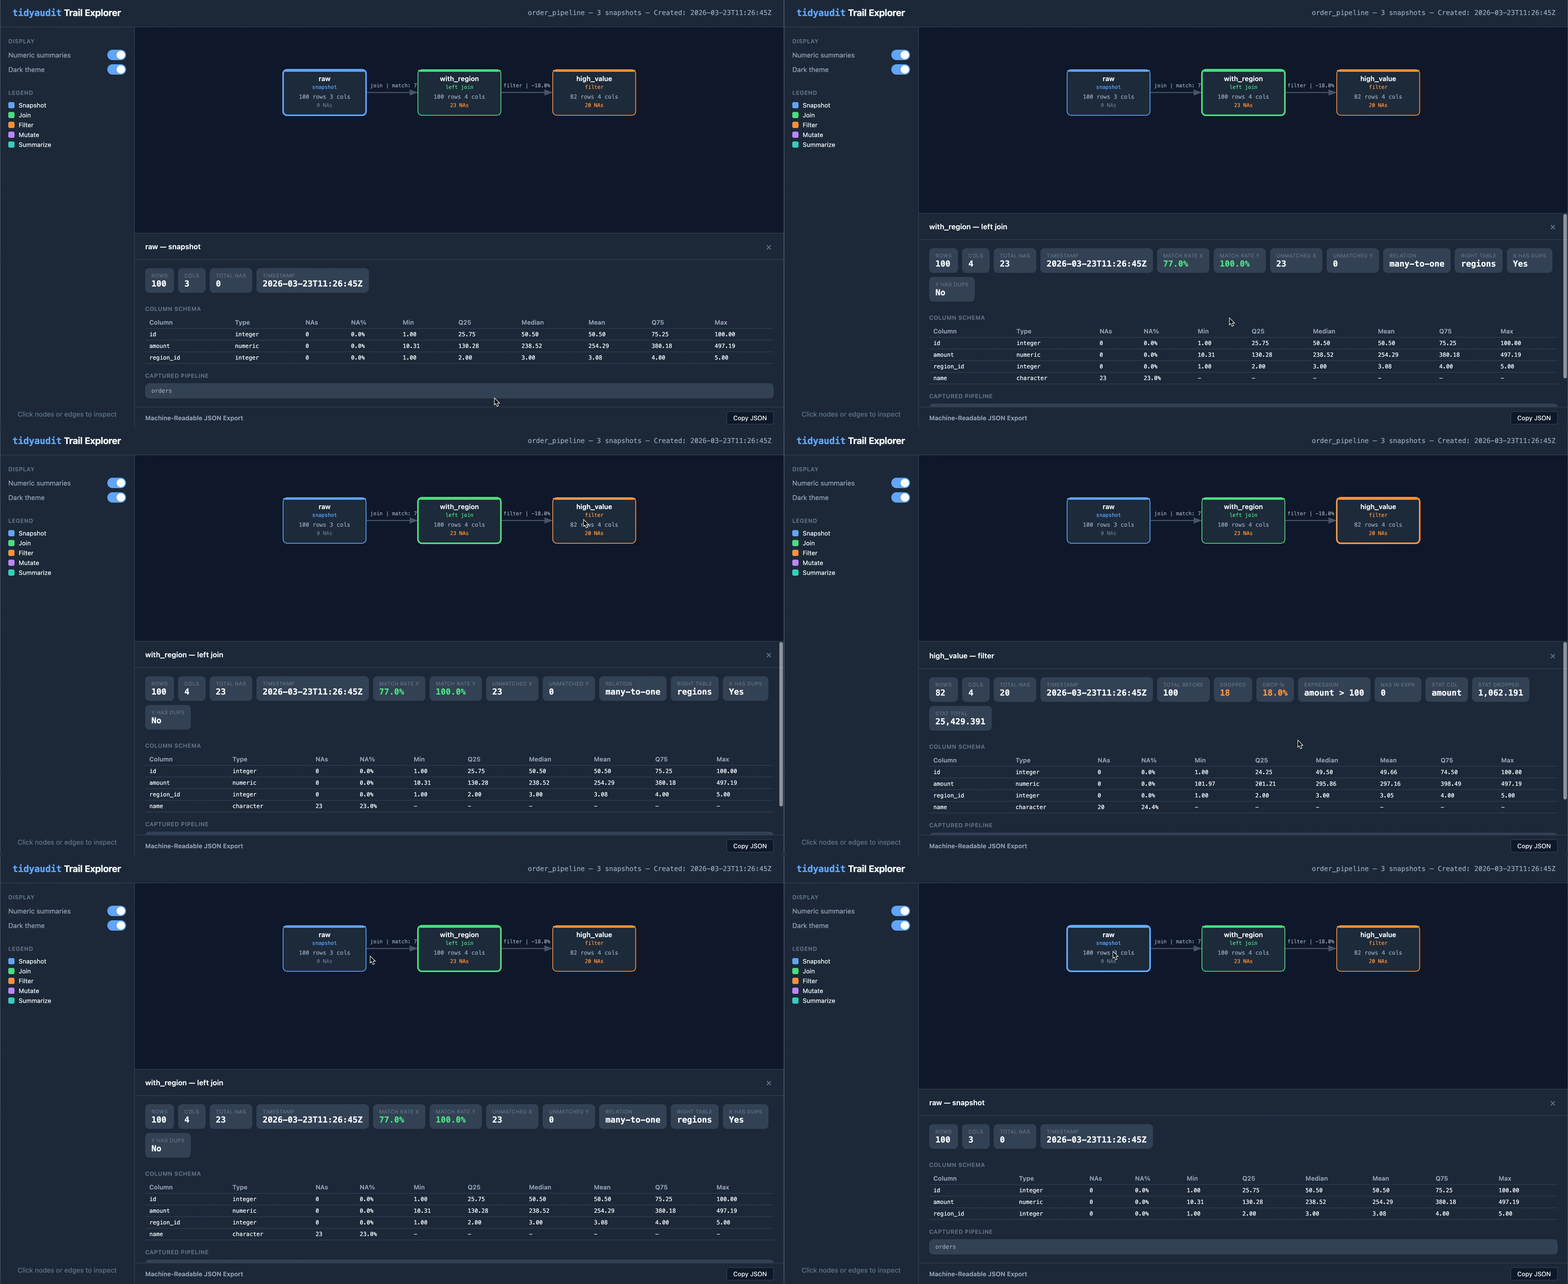
Share a trail as a self-contained HTML file — one file you can email, attach to a report, or drop into a compliance folder:
audit_export(trail, "order_pipeline.html")
The output is an interactive flow diagram with clickable nodes and edges, light/dark theme toggle, and embedded JSON export. No server or internet required.
Features
Audit trail system
Build a structured timeline of your pipeline's behavior. Drop taps into any dplyr pipe and get a traceable, diffable, exportable record of every step.
audit_trail()/audit_tap()— create a trail and record snapshots inside pipesleft_join_tap(),filter_tap(), and friends — operation-aware taps that capture match rates, drop counts, stat impact, and relationship typestab_tap()— track frequency distributions across pipeline stepsaudit_diff()— before/after comparison of any two snapshotsaudit_report()— full pipeline report in one callaudit_export()— self-contained HTML visualizationwrite_trail()/read_trail()— serialize to RDS or JSON for CI pipelines and dashboards- Snapshot controls (
.numeric_summary,.cols_include,.cols_exclude) — fine-tune what each tap captures
Diagnostic toolkit
Standalone functions for interactive data exploration — the questions you ask in the console before, during, and after building a pipeline.
validate_join()— analyze a join before performing it (match rates, duplicates, unmatched keys)validate_primary_keys()/validate_var_relationship()— key and relationship validationcompare_tables()— column, row, numeric, and categorical comparison between two data framesfilter_keep()/filter_drop()— filter with diagnostic output and configurable warning thresholdsdiagnose_nas()/summarize_column()/get_summary_table()— data quality diagnosticsdiagnose_strings()/audit_transform()— string quality auditing and type-aware transformation diagnosticstab()— frequency tables and crosstabulations with sorting, cutoffs, and weighting
Installation
# Install from CRAN
install.packages("tidyaudit")

# Install development version
pak::pak("fpcordeiro/tidyaudit")
Learn more
- Audit trail walkthrough — build your first trail, use operation-aware taps, export and share results
- Diagnostic functions guide — validate joins, compare tables, diagnose data quality, and more
Relationship to dtaudit
tidyaudit is the tidyverse-native counterpart to dtaudit, a data.table-based package on CRAN. Same design vocabulary, independent implementations — choose the one that matches your stack.
License
LGPL (>= 3)