standardlastprofile
BDEW Standard Load Profiles for Electricity and Gas
Provides standard load profiles (SLPs) for electricity and gas published by the German Association of Energy and Water Industries (BDEW Bundesverband der Energie- und Wasserwirtschaft e.V.) in a tidy format. The electricity profiles cover the 1999 profiles — households (H0), commercial (G0–G6), and agriculture (L0–L2) — and the updated 2025 profiles (H25, G25, L25, P25, S25), which additionally represent households with photovoltaic systems and battery storage. An interface generates an electricity load profile over a user-defined date range. A second interface generates daily standard load profiles for gas using the synthetic 'SigLinDe' method. More information on the data and methodology for electricity is described in "Standardlastprofile Strom", < https://www.bdew.de/energie/standardlastprofile-strom/>, and for gas in "Standardlastprofile Gas", < https://www.bdew.de/energie/standardlastprofile-gas/>.
standardlastprofile


Standard load profiles (SLPs) for electricity and gas, published by the German Association of Energy and Water Industries (BDEW Bundesverband der Energie- und Wasserwirtschaft e.V.). SLPs are used by utilities, distribution network operators, and the energy industry to forecast demand for customer groups that are not continuously metered.
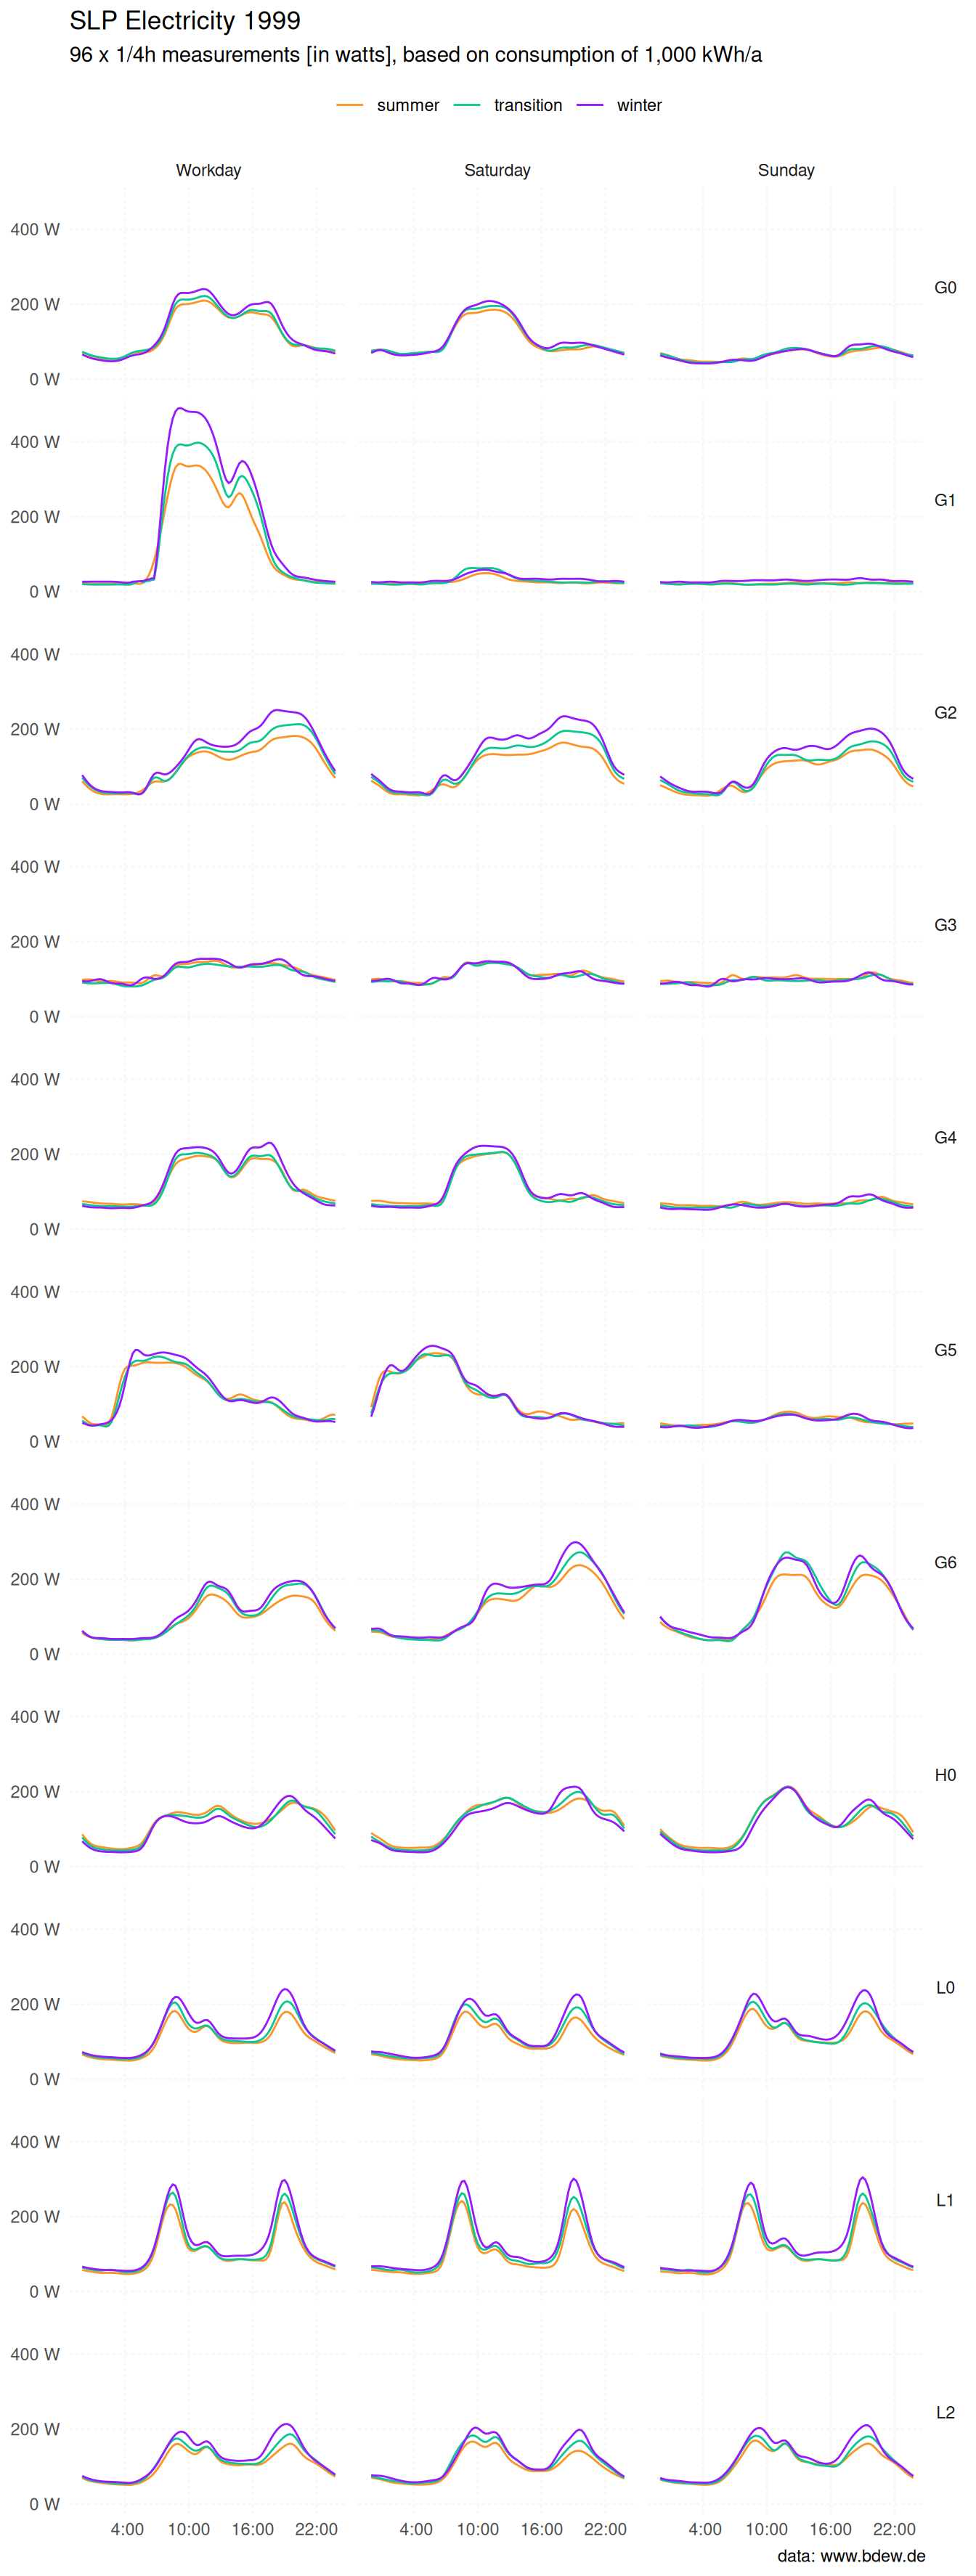
To learn more about SLPs for electricity, see article on Standardlastprofile Strom. To learn more about SLPS for gas and the details of the algorithm, how to fetch weather data from DWD, see article on Standardlastprofile Gas.
Installation
install.packages("standardlastprofile")
Included features
slp_info()— descriptions for all electricity and gas profile IDs
Electricity
slp_electricity()— generate a 15-minute profile for any date rangeslp_electricity_profiles— dataset of BDEW electricity SLPs in tidy format
Gas
slp_gas()— generate daily gas consumption via the SigLinDe methodslp_gas_coefficients()— retrieve SigLinDe coefficients for gas SLPsslp_gas_kundenwert()— derive the customer value (German: “Kundenwert”) from a reference temperature seriesslp_gas_siglinde()— low-level SigLinDe function, can be useful for custom or region-specific SigLinDe coefficientsslp_gas_weekday_factors()— retrieve weekday factors for gas SLPs
Electricity
The dataset slp_electricity_profiles contains 26,784 observations
across 5 variables:
profile_id: load profile identifierperiod:"summer","winter", or"transition"for 1999 profiles; a lowercase month name for 2025 profilesday:"workday","saturday", or"sunday"timestamp: quarter-hour start time in"%H:%M"formatwatts: average electric power, normalised to 1,000 kWh/a
str(slp_electricity_profiles)
#> 'data.frame':    26784 obs. of  5 variables:
#>  $ profile_id: chr  "H0" "H0" "H0" "H0" ...
#>  $ period    : chr  "winter" "winter" "winter" "winter" ...
#>  $ day       : chr  "saturday" "saturday" "saturday" "saturday" ...
#>  $ timestamp : chr  "00:00" "00:15" "00:30" "00:45" ...
#>  $ watts     : num  70.8 68.2 65.9 63.3 59.5 55 50.5 46.6 43.9 42.3 ...
1999 profiles
Based on an analysis of 1,209 load profiles of low-voltage electricity consumers in Germany^1:
H0: householdsG0–G6: commercialL0–L2: agriculture
2025 profiles
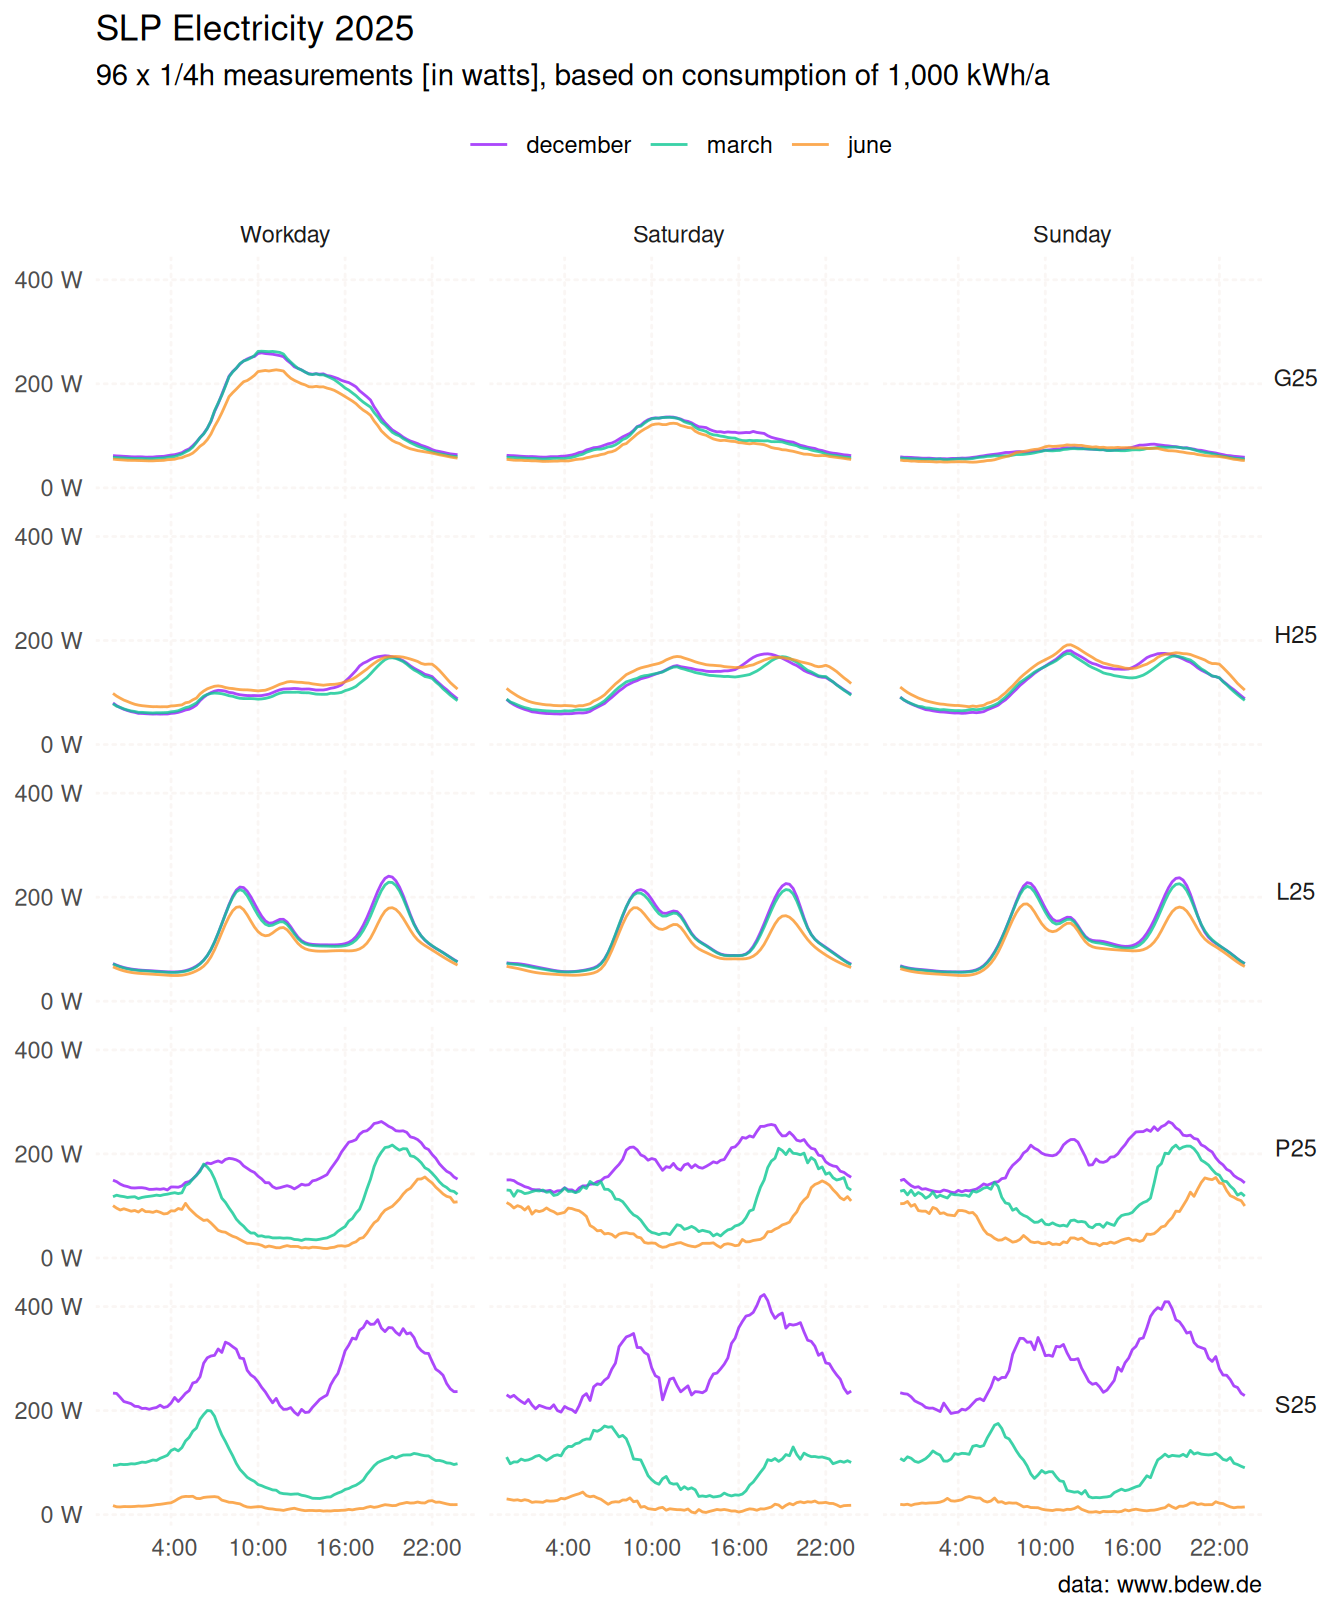
An updated set published by BDEW in 2025, reflecting changes in consumption patterns since the original study. Unlike the 1999 profiles (three seasonal periods), the 2025 profiles provide values for each calendar month:
H25,G25,L25: updated household, commercial, and agriculture profilesP25: households with a photovoltaic (PV) systemS25: households with a PV system and battery storage
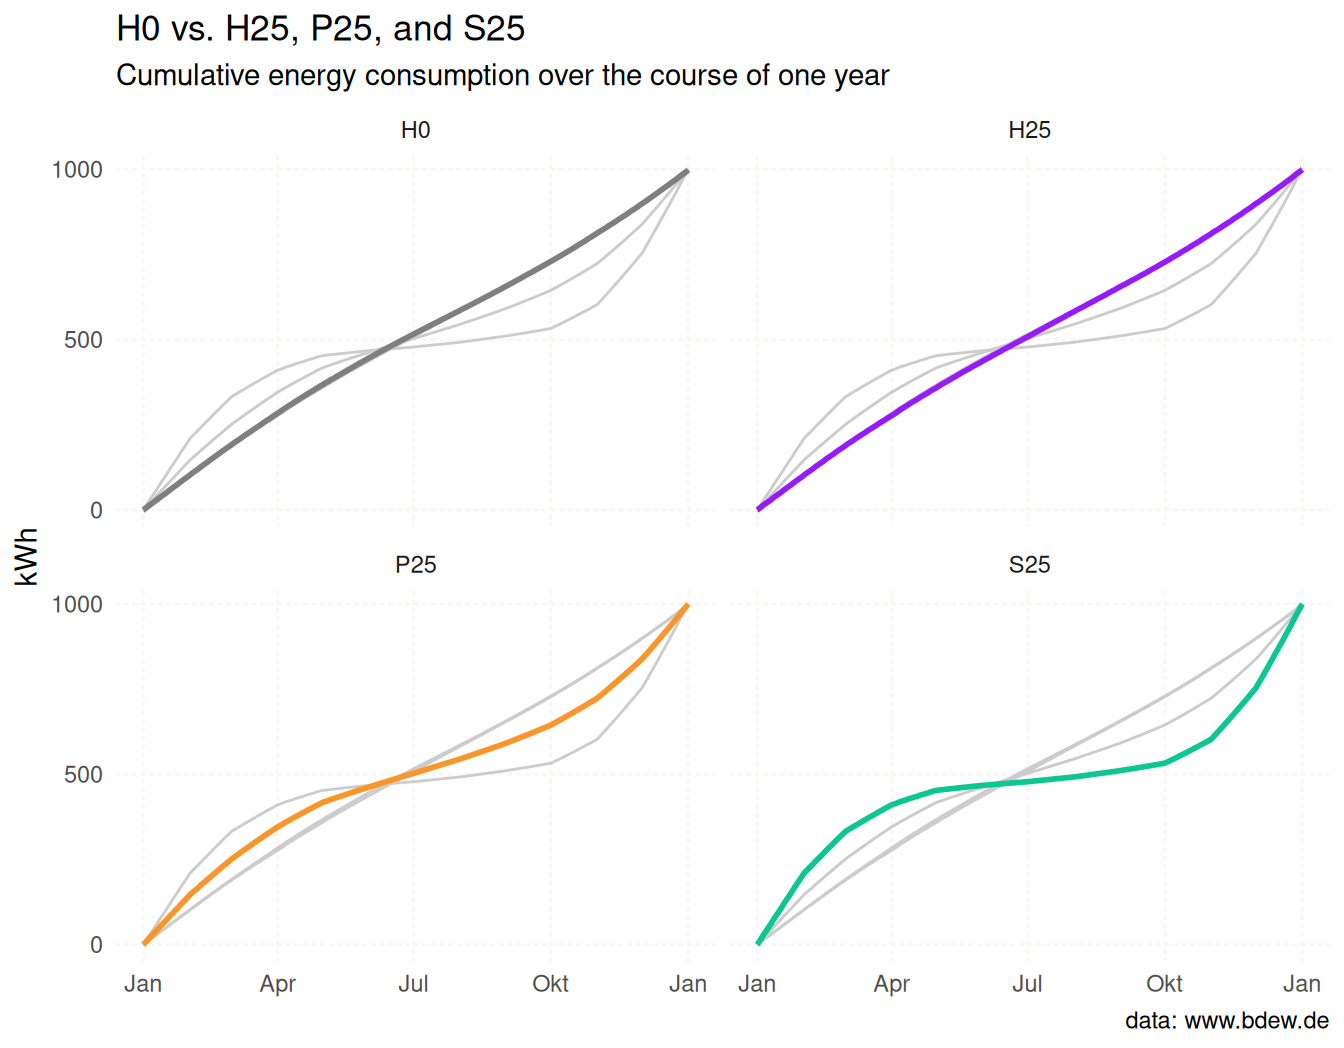
The chart below compares cumulative energy consumption of the 2025
household profiles against H0 over a full year. H25 tracks H0
closely; P25 and S25 flatten from spring through summer as solar
generation and storage reduce grid draw.
Generate a profile
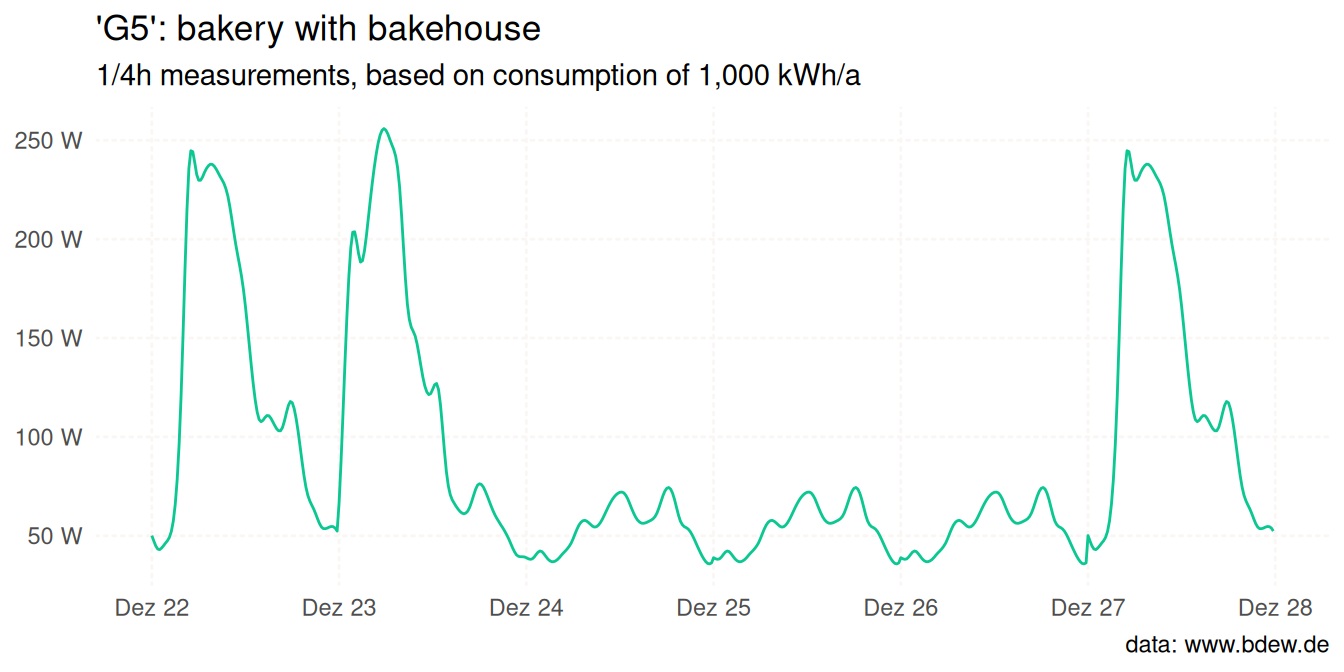
slp_electricity() returns a data frame with one row per 15-minute
interval:
G5 <- slp_electricity(
  profile_id = "G5",
  start_date = "2023-12-22",
  end_date   = "2023-12-27"
)

head(G5)
#>   profile_id          start_time            end_time watts
#> 1         G5 2023-12-22 00:00:00 2023-12-22 00:15:00  50.1
#> 2         G5 2023-12-22 00:15:00 2023-12-22 00:30:00  47.4
#> 3         G5 2023-12-22 00:30:00 2023-12-22 00:45:00  44.9
#> 4         G5 2023-12-22 00:45:00 2023-12-22 01:00:00  43.3
#> 5         G5 2023-12-22 01:00:00 2023-12-22 01:15:00  43.0
#> 6         G5 2023-12-22 01:15:00 2023-12-22 01:30:00  43.8
Public holidays
Both slp_electricity() and slp_gas() use the same holiday logic:
nine nationwide German public holidays are treated as Sundays by
default:
- New Year’s
- Good Friday
- Easter Monday
- Labour Day
- Ascension Day
- Whit Monday
- German Unity Day
- Christmas Day
- Boxing Day
State-level holidays are not included because they vary by state and
year. Use the holidays argument in either function to supply your own
dates — the built-in data are then ignored entirely. See the
electricity
article
for an example of how to fetch state-level holidays from the nager.Date
API.
Gas
slp_gas() implements the BDEW/VKU/GEODE synthetic procedure (SigLinDe
method)
for daily gas consumption. The gas consumption on any particular day is
influenced by three factors:
- outside temperature
- personal preferences (
kundenwert) - the day of the week
slp_gas() hence takes a date vector for which the gas consumption
should be calculated, a vector of daily mean temperatures and a
kundenwert (customer value in kWh/day), together with one of 15 gas
profile IDs.
Pass dates and temps to slp_gas() together with the kundenwert.
The
kundenwertof 55.1 kWh/day is itself derived once, from the customer’s annual consumption and a reference temperature series. See the gas article for that step and the full method.
The result of slp_gas() is a data frame with three columns:
profile_id, date, and kwh which is the daily gas consumption:
HEF <- slp_gas("HEF", dates, temps, kundenwert = 55.1)
head(HEF)
#>   profile_id       date      kwh
#> 1        HEF 2025-10-01 40.95047
#> 2        HEF 2025-10-02 32.50304
#> 3        HEF 2025-10-03 31.91795
#> 4        HEF 2025-10-04 27.32729
#> 5        HEF 2025-10-05 32.50304
#> 6        HEF 2025-10-06 30.17767
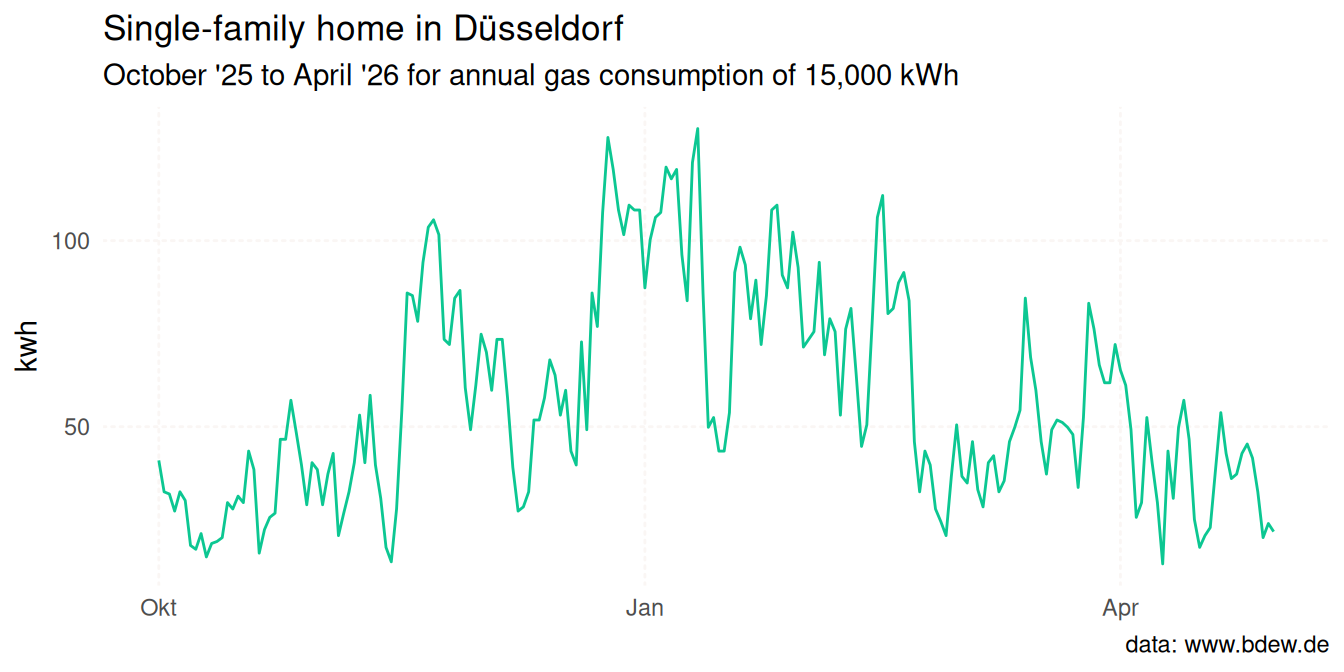
In the example above we assumed a single-family home (profile HEF) in
Düsseldorf.
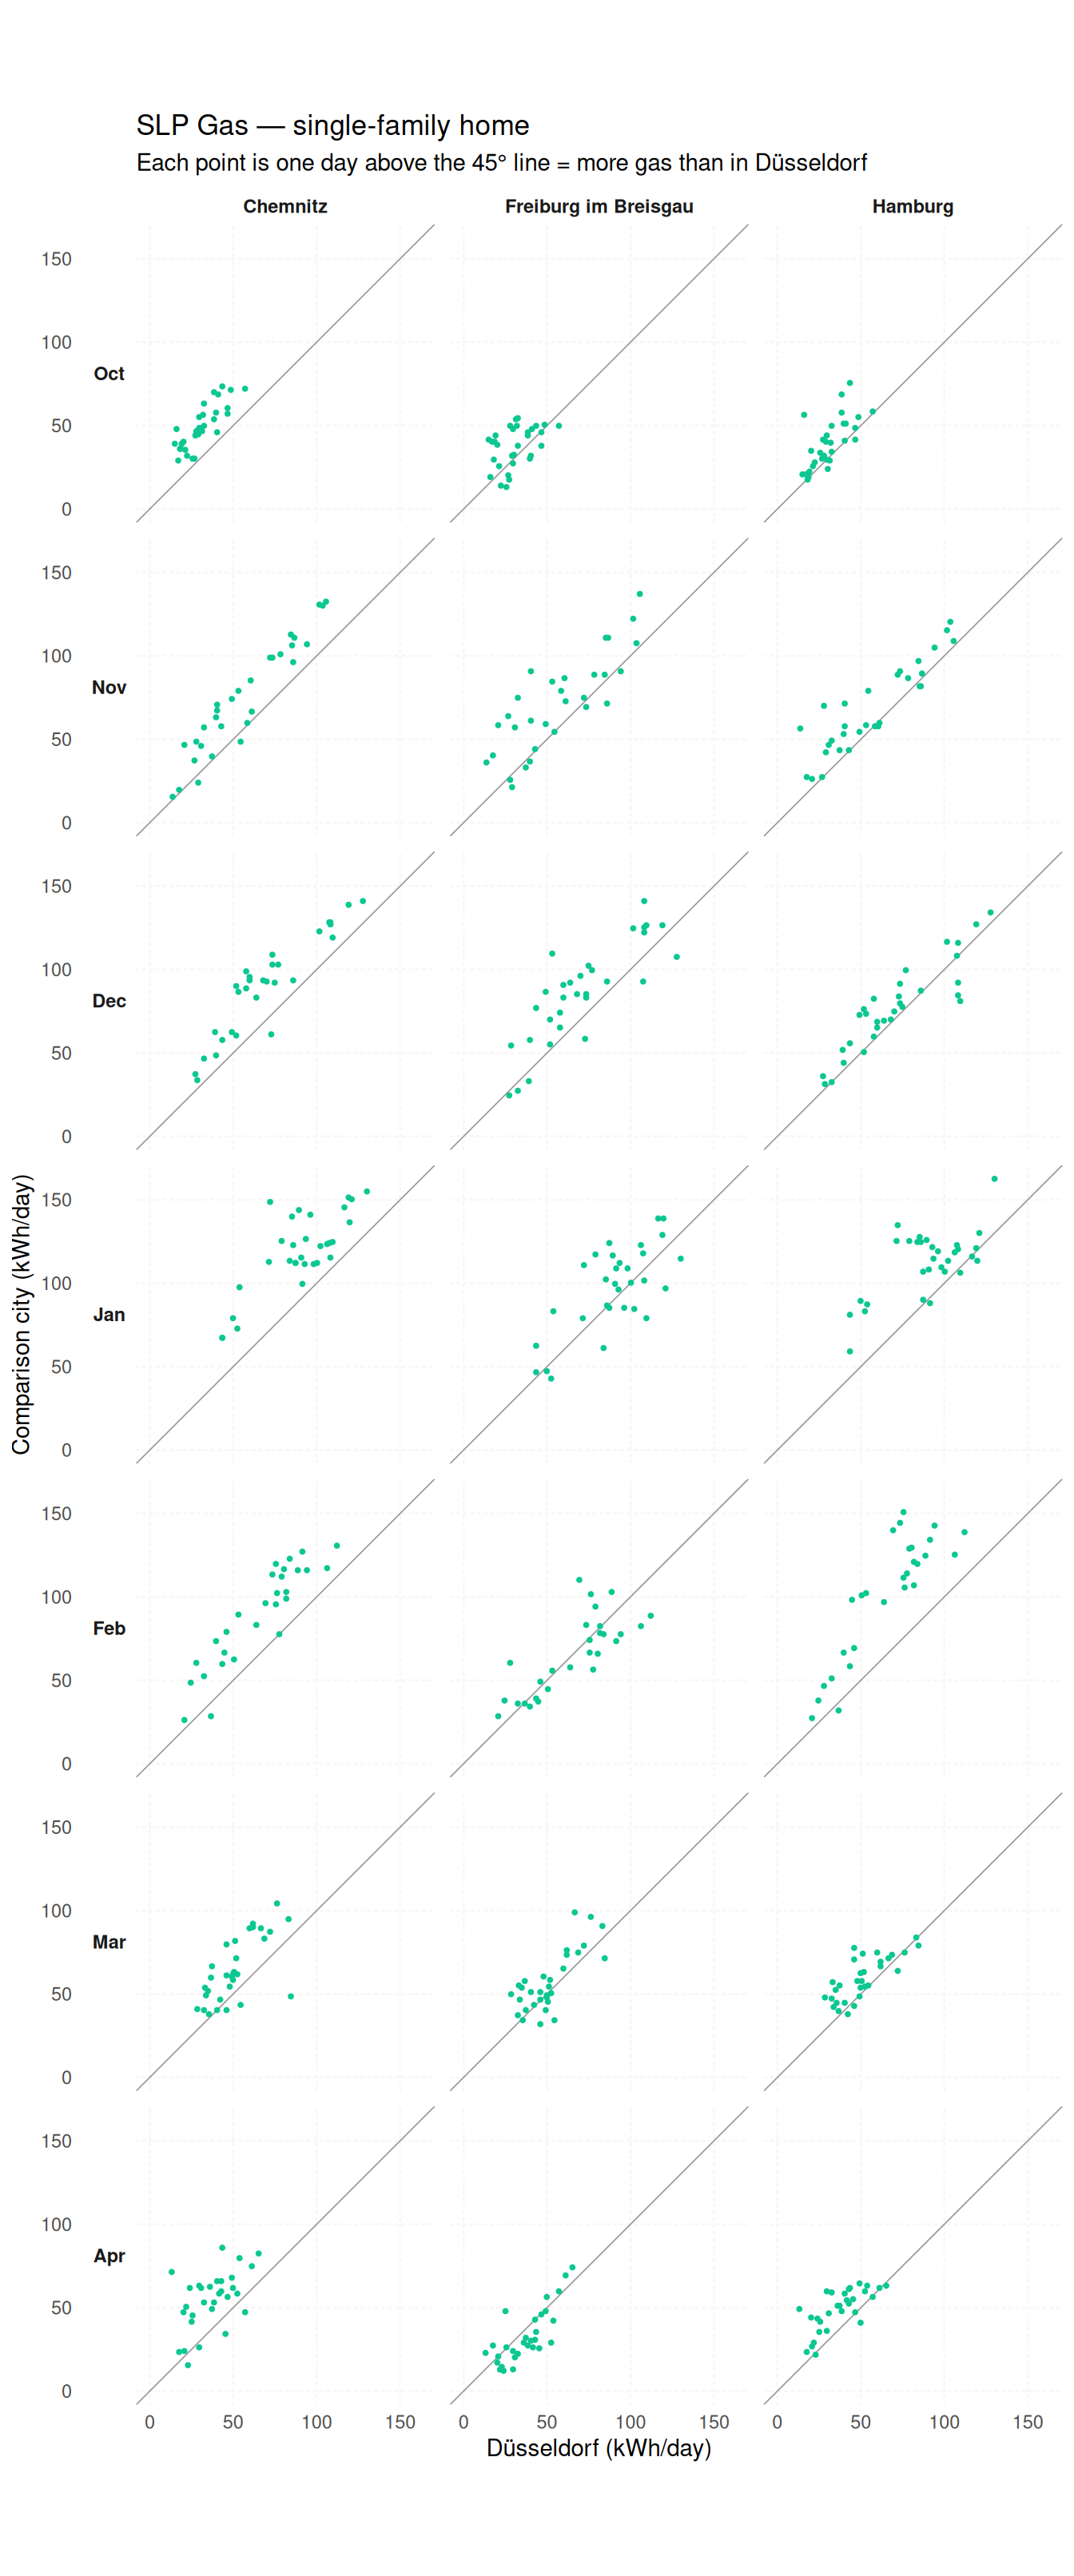
In the following graph, we compare the same customer (i.e. we set the
kundenwert) for the same period – October 2025 to April 2026 – with
three other locations. This allows us to isolate the influence of the
outside temperature on gas consumption in these cities:
- Chemnitz,
- Freiburg im Breisgau, and
- Hamburg.
Each point represents a single day in the period from 1 October 2025 to 30 April 2026. Points above the 45° line indicate that the customer would have consumed more gas than in Düsseldorf. We can see that this winter was colder in all three cities than in Düsseldorf, so all the points lie above the line – most notably in Chemnitz, least so in Freiburg im Breisgau, with Hamburg in between:
For a detailed explanation of the SigLinDe parameters and the full climate zone comparison, see the gas articles on the package website.
Sources
- Electricity SLPs: https://www.bdew.de/energie/standardlastprofile-strom/
- Gas SLPs: https://www.bdew.de/energie/standardlastprofile-gas/
Code of Conduct
Please note that this project is released with a Contributor Code of Conduct. By participating in this project you agree to abide by its terms.
<https://web.archive.org/web/20260620060837/https://www.bdew.de/media/documents/1999_Repraesentative-VDEW-Lastprofile.pdf>