spduration
Split-Population Duration (Cure) Regression
An implementation of split-population duration regression models. Unlike regular duration models, split-population duration models are mixture models that accommodate the presence of a sub-population that is not at risk for failure, e.g. cancer patients who have been cured by treatment. This package implements Weibull and Loglogistic forms for the duration component, and focuses on data with time-varying covariates. These models were originally formulated in Boag (1949) and Berkson and Gage (1952), and extended in Schmidt and Witte (1989).
spduration 


spduration implements a split-population duration model for duration data with time-varying covariates where a significant subset of the population or spells will not experience failure.
library("spduration")
## Registered S3 method overwritten by 'quantmod':
##   method            from
##   as.zoo.data.frame zoo
# Prepare data
data(coups)
dur.coups <- add_duration(coups, "succ.coup", unitID="gwcode", tID="year",
                          freq="year")

# Estimate model
model.coups <- spdur(duration ~ polity2, atrisk ~ polity2, data = dur.coups,
                     silent = TRUE)
summary(model.coups)
## Call:
## spdur(duration = duration ~ polity2, atrisk = atrisk ~ polity2,
##     data = dur.coups, silent = TRUE)
##
## Duration equation:
##             Estimate Std. Error t value Pr(>|t|)
## (Intercept)  4.00151    0.23762  16.840  < 2e-16 ***
## polity2      0.20588    0.03037   6.779 1.21e-11 ***
##
## Risk equation:
##             Estimate Std. Error t value Pr(>|t|)
## (Intercept)   6.5279     3.2556   2.005   0.0449 *
## polity2       0.8967     0.4084   2.196   0.0281 *
##
##            Estimate Std. Error t value Pr(>|t|)
## log(alpha) -0.03203    0.11899  -0.269    0.788
## ---
## Signif. codes: *** = 0.001, ** = 0.01, * = 0.05, . = 0.1
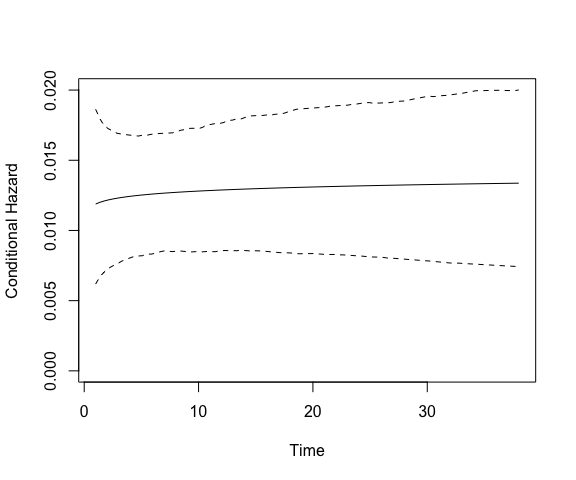
plot(model.coups, type = "hazard")
Install
- the latest released version from CRAN:
install.packages("spduration")
- the latest development version:
library(devtools)
install_github("andybega/spduration")
Contact
- submit suggestions, bugs, issues, questions at: https://github.com/andybega/spduration/issues
- email: [email protected]