sitsfeats
Satellite Image Time Series Features
Provides a set of temporal metrics derived from satellite image time series.
The basics metrics are composed of basic statistics, histogram-based statistics, and methods
based on time series analysis.
The polar metrics, an approach proposed by Korting et al. (2013)
sitsfeats - Satellite Image Time Series Features 
R package for extracting metrics from time series of satellite images


The goal of the sitsfeats package is to extract temporal metrics from satellite images time series. The metrics implemented in this version are:
- basics: statistics metrics
- polar: polar metrics
The implementations of this package are based on the stmetrics library in Python.
Installation
You can install the development version of sitsfeats from github with:
library(devtools)
devtools::install_github("oldlipe/sitsfeats")
How to use?
Polar metrics example
# loading sitsfeats and tibble packages
library(sitsfeats)
library(tibble)

# loading example time series
data("timeseries")

polar_metrics <- tibble::tibble(area_q1 = sitsfeats::area_q1(timeseries),
                                area_q2 = sitsfeats::area_q2(timeseries),
                                area_q3 = sitsfeats::area_q3(timeseries),
                                area_q4 = sitsfeats::area_q3(timeseries))

polar_metrics
#> # A tibble: 5 x 4
#>   area_q1[,1] area_q2[,1] area_q3[,1] area_q4[,1]
#>         <dbl>       <dbl>       <dbl>       <dbl>
#> 1   29443841.   14207184.   30180681.   30180681.
#> 2   28600327.   11275172.   32912031.   32912031.
#> 3   39626598.   26313817.   39566583.   39566583.
#> 4   37874557.   16023772.   34952318.   34952318.
#> 5   23932473.   15016832.   27336259.   27336259.
Polar metrics visualization
# get one instance from timeseries
one_instance <- timeseries[1,]

# plot first time series example
sitsfeats::polar_plot(one_instance)
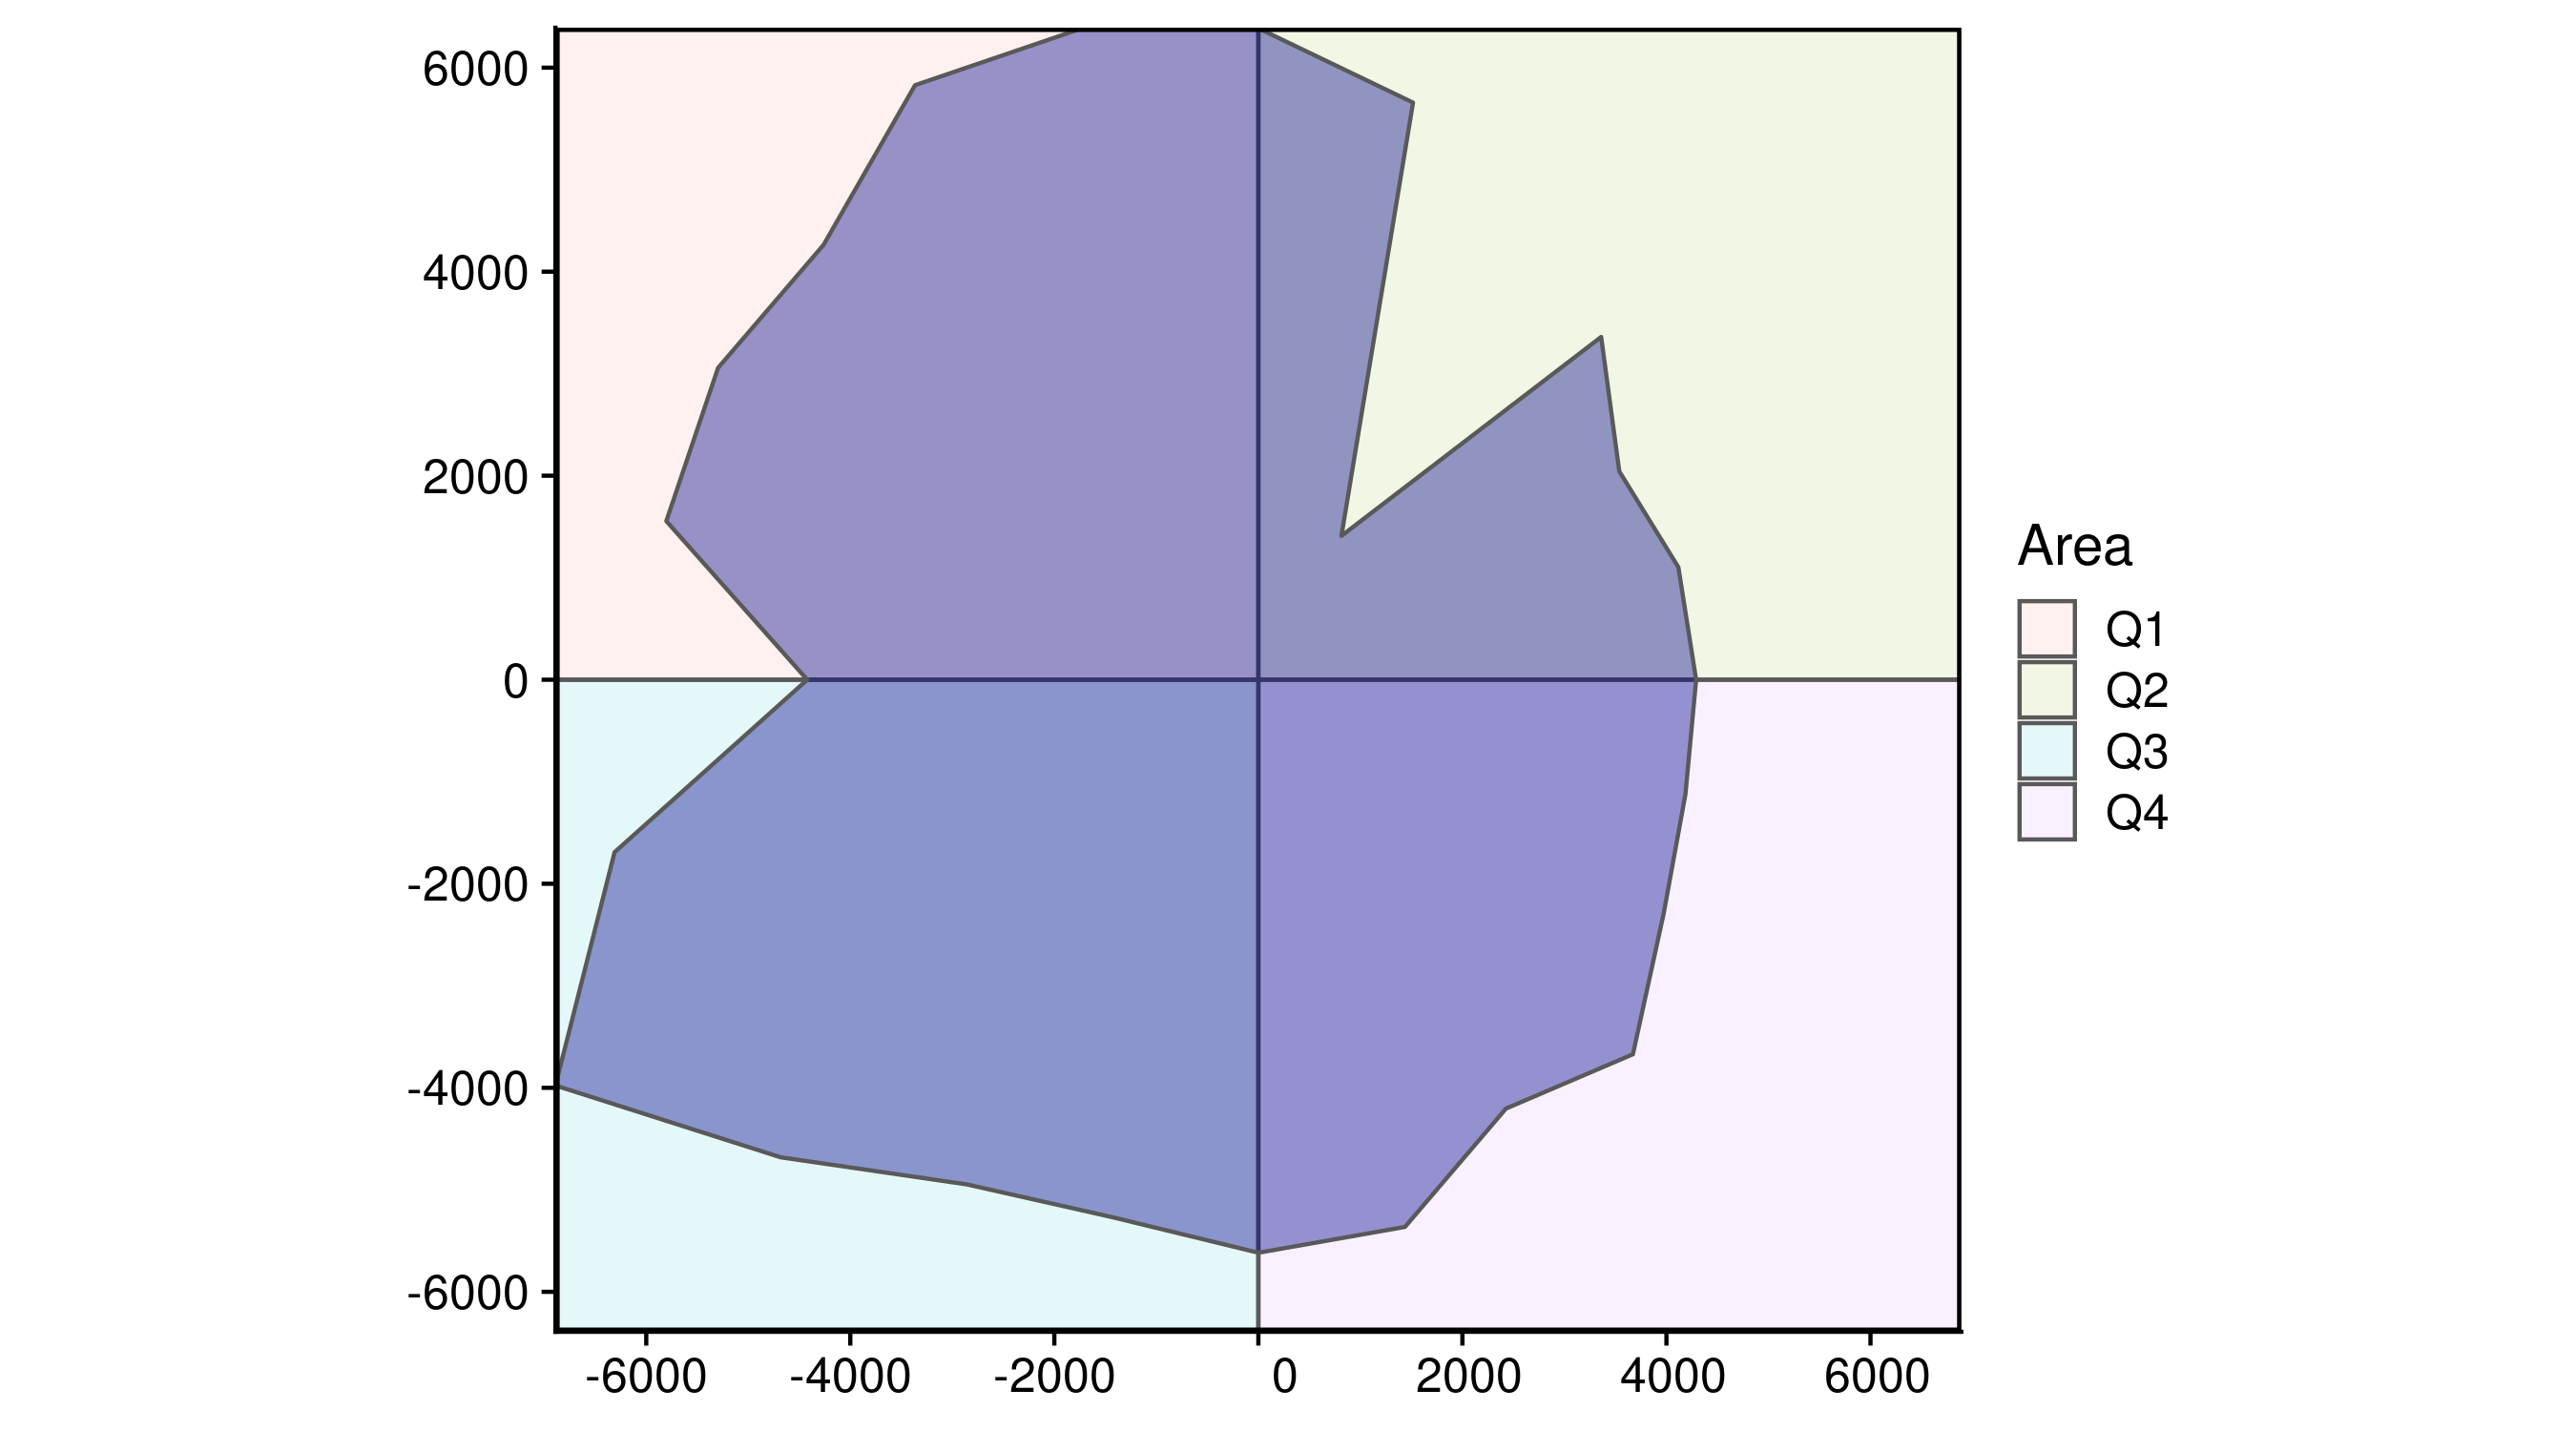
Getting help
Feel free to create issues if you have any questions.