rtide
Tide Heights
Calculates tide heights based on tide station harmonics. It includes the harmonics data for 637 US stations. The harmonics data was converted from < https://github.com/poissonconsulting/rtide/blob/main/data-raw/harmonics-dwf-20151227-free.tar.bz2>, NOAA web site data processed by David Flater for 'XTide'. The code to calculate tide heights from the harmonics is based on 'XTide'.
rtide


Introduction
rtide is an R package to calculate tide heights based on tide station
harmonics.
It includes the harmonics data for 637 US stations.
Installation
To install the latest release from CRAN
install.packages("rtide")
To install the developmental version from GitHub
# install.packages("pak")
pak::pak("millerlp/rtide")
Utilisation
library(tibble)
library(rtide)
#> rtide is not suitable for navigation

data <- rtide::tide_height(
  "Monterey Harbor",
  from = as.Date("2016-07-13"), to = as.Date("2016-07-15"),
  minutes = 10L, tz = "America/Los_Angeles"
)

print(data)
#> # A tibble: 432 × 3
#>    Station                               DateTime            TideHeight
#>    <chr>                                 <dttm>                   <dbl>
#>  1 Monterey, Monterey Harbor, California 2016-07-13 00:00:00      0.514
#>  2 Monterey, Monterey Harbor, California 2016-07-13 00:10:00      0.496
#>  3 Monterey, Monterey Harbor, California 2016-07-13 00:20:00      0.481
#>  4 Monterey, Monterey Harbor, California 2016-07-13 00:30:00      0.468
#>  5 Monterey, Monterey Harbor, California 2016-07-13 00:40:00      0.457
#>  6 Monterey, Monterey Harbor, California 2016-07-13 00:50:00      0.449
#>  7 Monterey, Monterey Harbor, California 2016-07-13 01:00:00      0.443
#>  8 Monterey, Monterey Harbor, California 2016-07-13 01:10:00      0.440
#>  9 Monterey, Monterey Harbor, California 2016-07-13 01:20:00      0.439
#> 10 Monterey, Monterey Harbor, California 2016-07-13 01:30:00      0.441
#> # ℹ 422 more rows
library(ggplot2)
library(scales)
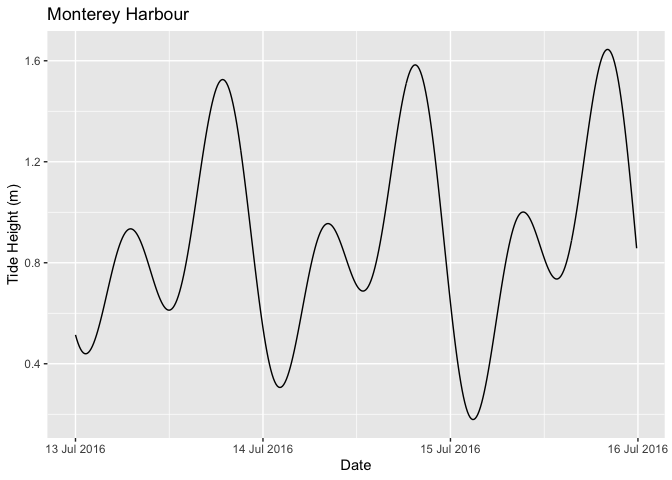
ggplot(data = data, aes(x = DateTime, y = TideHeight)) +
  geom_line() +
  scale_x_datetime(
    name = "Date",
    labels = date_format("%d %b %Y", tz = "America/Los_Angeles")
  ) +
  scale_y_continuous(name = "Tide Height (m)") +
  ggtitle("Monterey Harbour")
Shiny
Tide heights can be also obtained using rtide through a shiny interface developed by Seb Dalgarno.
Contribution
Please report any issues.
Pull requests are always welcome.
Inspiration
The harmonics data was converted from
https://github.com/poissonconsulting/rtide/blob/main/data-raw/harmonics-dwf-20151227-free.tar.bz2,
NOAA web site data processed by David Flater for
XTide. The code to calculate tide
heights from the harmonics is based on XTide.